
Section 4.8 Outlier Analysis
In the previous section on partisan gerrymandering, each measure compared election results to some version of proportional representation, but in many states proportionality may not be the appropriate baseline.
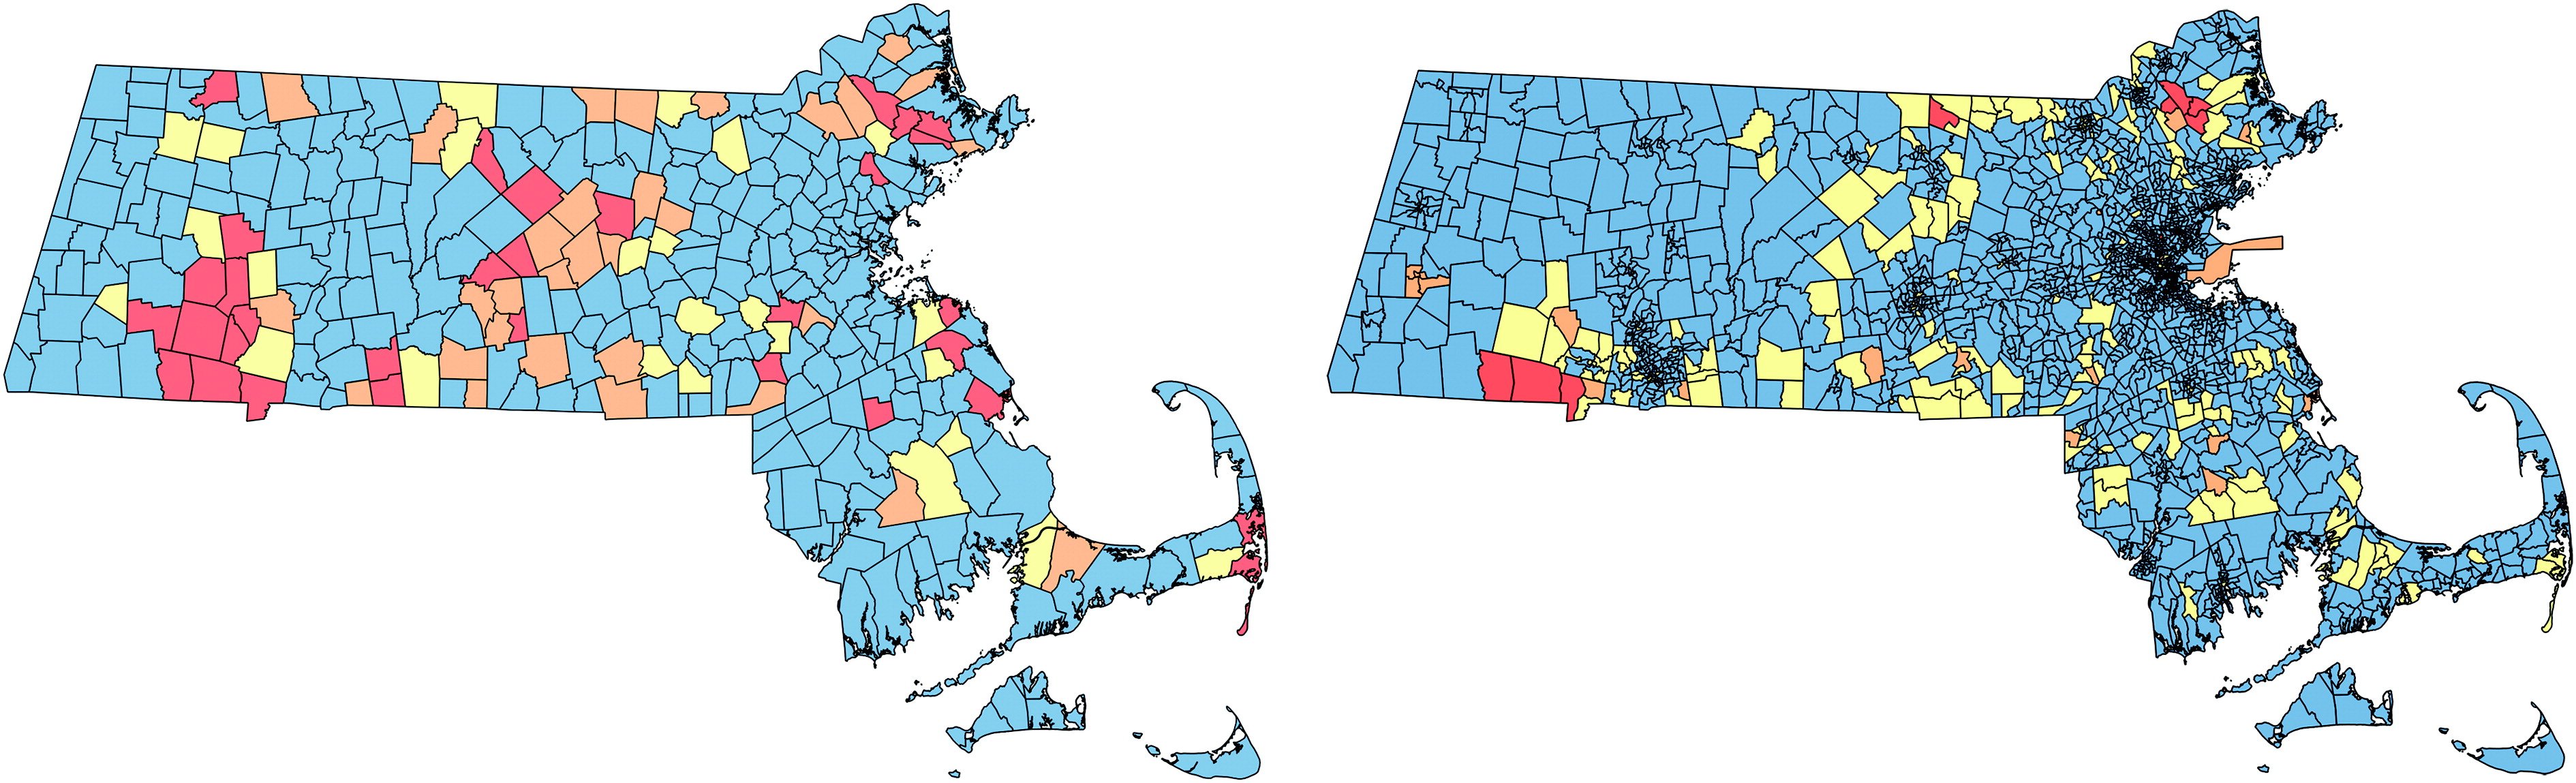
Consider the recent history of congressional districts in the state of Massachusetts. As of 2021, Massachusetts has 9 House districts, all of which have been represented by Democrats for over 25 years. In fact, the last time a Republican represented Massachusetts was in 1994 and Democrats have won 125 consecutive House elections! Despite the lopsided nature of the state's representation, their map is not controversial and has not been challenged for any type of gerrymandering.
Why is this result not controversial? Republicans do exist in Massachusetts and regularly receive between 30 and 40 percent of the vote in statewide elections (President, Governor, Senate). Proportional representation would give Republicans 3 of the 9 congressional districts; however, even though the possible number of valid districting plans exceeds the number of particles in the universe, it is impossible to come up a plan that yields even one Republican district! [4.12.36] This is simply due to the geography and the fact that there are no large Republican enclaves within the state. Due to the natural distribution of their voters, they do not form a majority in any region of Massachusetts, leading to their prolonged lack of representation in Congress.
Motivating Question: If proportionality isn't necessarily an appropriate benchmark, what should we measure a district plan against? Can we determine if a plan produces an unlikely result?
Definition 4.8.2.
An outlier is an observation that is unusual within a given context. In a large set of possible district plans, those with unlikely outcomes relative to the rest may be outliers, hence the term outlier analysis. There are many different criteria for determining outliers (or potential outliers) in statistics; we will not cover those in depth here.Let's suppose a state with 7 districts has a proposed district plan in which the Heart Party is favored to win 6 of the 7 districts. A computer program generates 1,000,000 possible district plans and in only 100 of the plans is the Heart Party favored to win as many as 6 of the districts. Due to the unlikely nature of this outcome (occurring in only 0.01% of plans), there is evidence that the proposed plan may have been manipulated to benefit the Heart Party. That is, it represents a potential outlier.
Consider the following distribution of voters.
| \(\heartsuit \) | \(\clubsuit \) | \(\clubsuit \) | \(\clubsuit \) | \(\clubsuit \) |
| \(\heartsuit \) | \(\clubsuit \) | \(\heartsuit \) | \(\heartsuit \) | \(\clubsuit \) |
| \(\clubsuit \) | \(\heartsuit \) | \(\heartsuit \) | \(\clubsuit \) | \(\heartsuit \) |
| \(\clubsuit \) | \(\clubsuit \) | \(\clubsuit \) | \(\clubsuit \) | \(\heartsuit \) |
| \(\clubsuit \) | \(\clubsuit \) | \(\clubsuit \) | \(\clubsuit \) | \(\clubsuit \) |
Suppose we want to create 5 districts of 5 voters each. Some quick math shows the best outcome for the Heart Party (with 8 total voters) is to win 2 districts and it would take some intentional packing and cracking to achieve that outcome. In the example below, we create plans that lead to this outcome.
Example 4.8.4.
Draw district lines for the map given above so that the Heart party wins two disticts. Create 5 districts of 5 voters each.
Hint.| \(\heartsuit \) | \(\clubsuit \) | \(\clubsuit \) | \(\clubsuit \) | \(\clubsuit \) |
| \(\heartsuit \) | \(\clubsuit \) | \(\heartsuit \) | \(\heartsuit \) | \(\clubsuit \) |
| \(\clubsuit \) | \(\heartsuit \) | \(\heartsuit \) | \(\clubsuit \) | \(\heartsuit \) |
| \(\clubsuit \) | \(\clubsuit \) | \(\clubsuit \) | \(\clubsuit \) | \(\heartsuit \) |
| \(\clubsuit \) | \(\clubsuit \) | \(\clubsuit \) | \(\clubsuit \) | \(\clubsuit \) |
| \(\heartsuit \) | \(\clubsuit \) | \(\clubsuit \) | \(\clubsuit \) | \(\clubsuit \) |
| \(\heartsuit \) | \(\clubsuit \) | \(\heartsuit \) | \(\heartsuit \) | \(\clubsuit \) |
| \(\clubsuit \) | \(\heartsuit \) | \(\heartsuit \) | \(\clubsuit \) | \(\heartsuit \) |
| \(\clubsuit \) | \(\clubsuit \) | \(\clubsuit \) | \(\clubsuit \) | \(\heartsuit \) |
| \(\clubsuit \) | \(\clubsuit \) | \(\clubsuit \) | \(\clubsuit \) | \(\clubsuit \) |
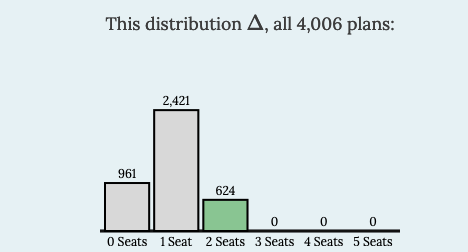
While the Heart Party achieves their best possible outcome, can we say that gerrymandering is present? In other words, is the outcome of this plan an outlier relative to other possible plans?
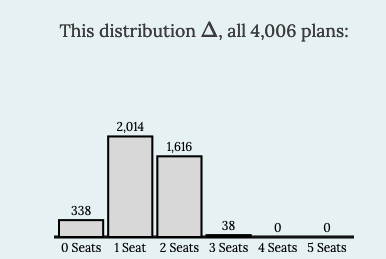
We can look at this from a couple of different perspectives. We turn to technology to help us, using the MGGG grid tool found here: MGGG grid tool (opens in new tab) 1 . It turns out that there are 4,006 ways to divide a 5x5 grid into 5 contiguous districts of 5 blocks each. The MGGG grid tool determines all 4,006 plans with the same location of voters shown here: 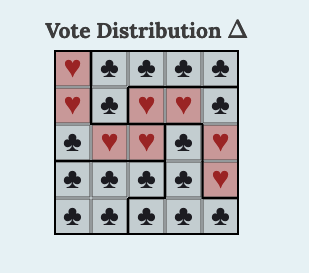
Alternatively, there are 1,081,575 different ways to place 8 Hearts and 17 Clubs in a 5x5 grid. This time, we consider all of these arrangements with the same district plan given above in Table 4.8.5 (the answer to Example 4.8.4), shown here. (Different colors denote different districts.) 
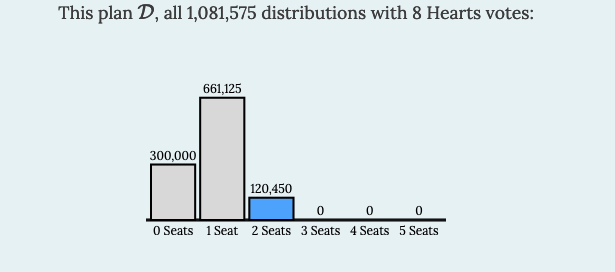
Either way, even though the Heart Party has maximum representation (2 seats), something happening more than 10% of the time is not all that uncommon. In research that uses statistics, 5% (1 in 20) is the most common threshold for determining whether an occurrence is considered an outlier. (Sometimes lower values such as 1% are used to capture only “stronger” outliers.)
Now suppose a ninth Heart is added to the district plan above (replacing any one of the Clubs). Mathematically, it is now possible for the Heart Party to win 3 districts, but even if they do, would it be considered an outlier and potential gerrymandering?
Example 4.8.11.
Go to the MGGG grid tool (opens in new tab) 2 and scroll down to the section with bar graphs. Create a grid that matches Table 4.8.3, then change one of the Clubs to a Heart so that there are exactly 9 Hearts. Then create a district plan (using “Build a Plan \(\mathcal{D}\)”) in which Hearts win 3 of the 5 districts. Observe the distributions to determine if your plan is an outlier.
Solution.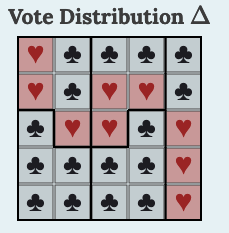
Although we can analyze all possible plans and distributions on a 5x5 grid, this is nowhere near possible with precincts on a real map. However, there are algorithmic techniques which can quickly generate thousands or millions of valid districting plans for the purpose of comparing a particular district plan of interest to an ensemble.
mggg.org/metagraph/5x5.htmlmggg.org/metagraph/5x5.html