
Section 2.5 Data Classification
Once you collect or obtain a data set, you need to choose which form of data visualization(s) would be appropriate for your data. But before you can determine the best form of data visualization, you need to classify your data. The nature of your data would help you determine the possible forms of visualizations. In the following section, we will discuss the different types of data with examples.
Subsection 2.5.1 Data types
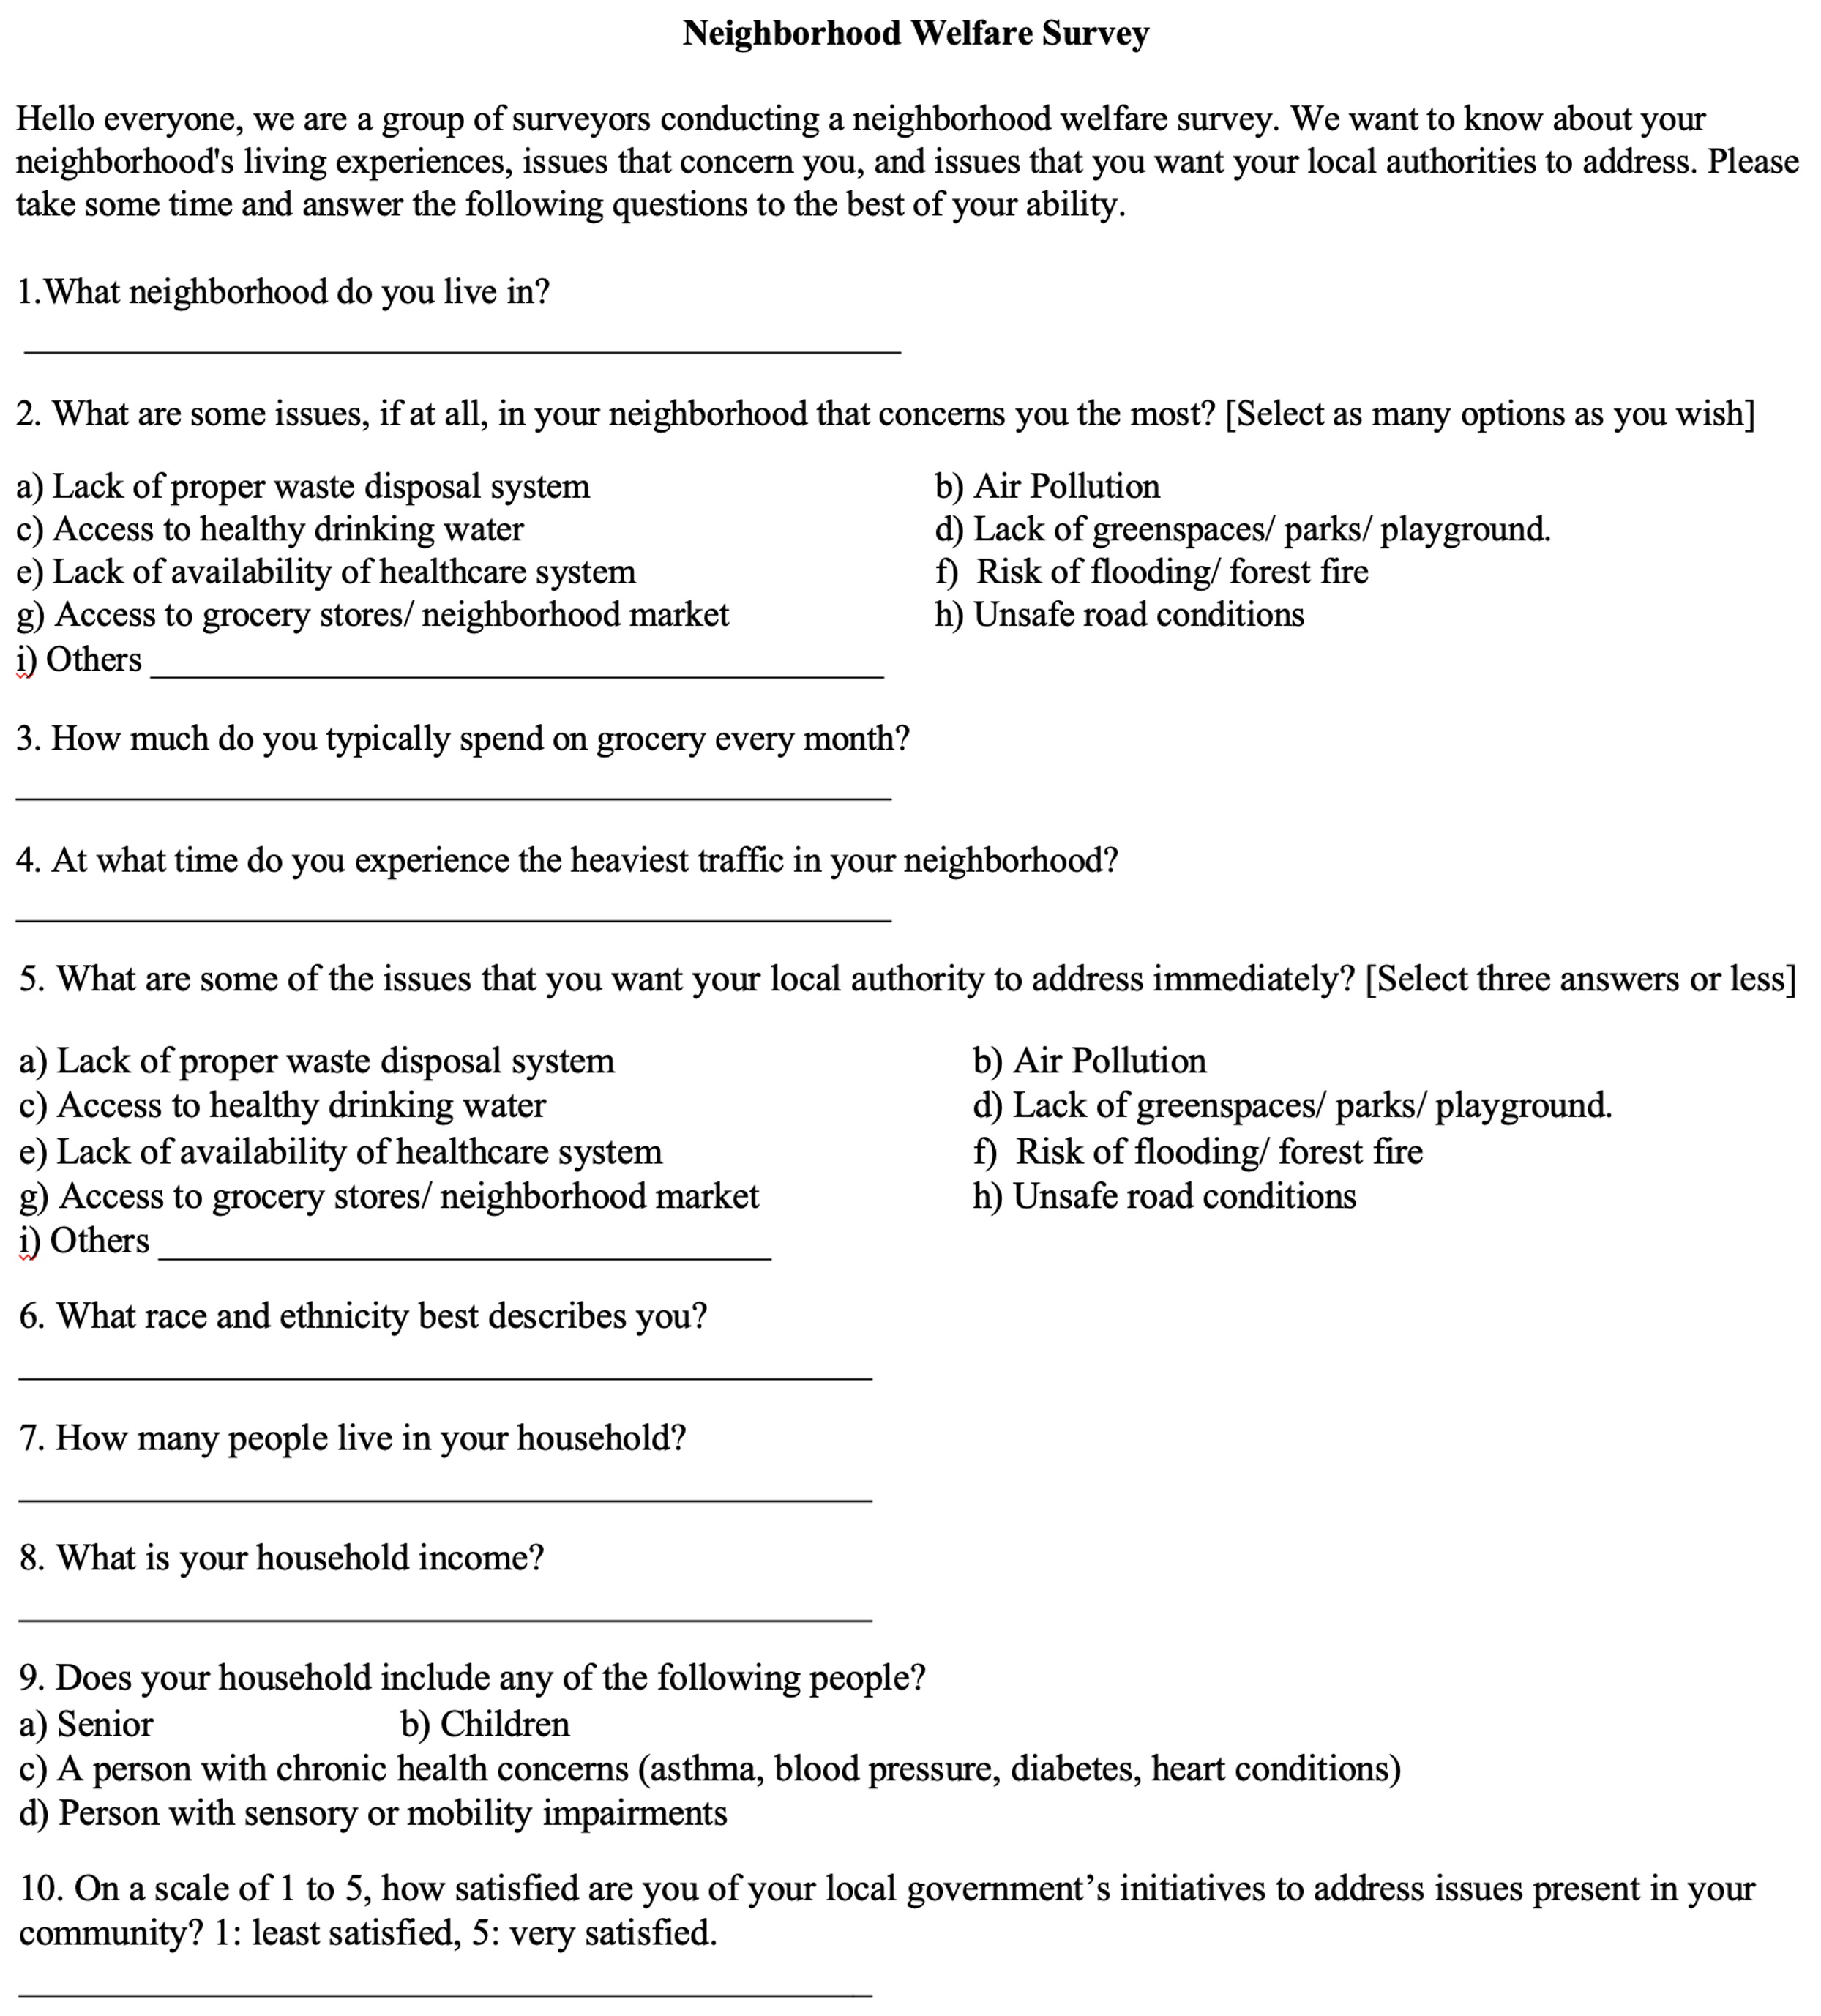
Let’s say you are conducting a neighborhood welfare survey. The survey aims to learn about the different issues the residents are concerned about and want the local authorities to address immediately. The survey contains a combination of ten closeWindow()d and open-ended questions. For details about the survey, see \vref{pictureX}. Overall, the survey questions collected two types of data: non-numeric (Questions 1, 2, 5, 6, 9) and numeric (Questions 3, 4, 7, 8, 10), based on which the data can be broadly classified into two types: categorical data and quantitative data.
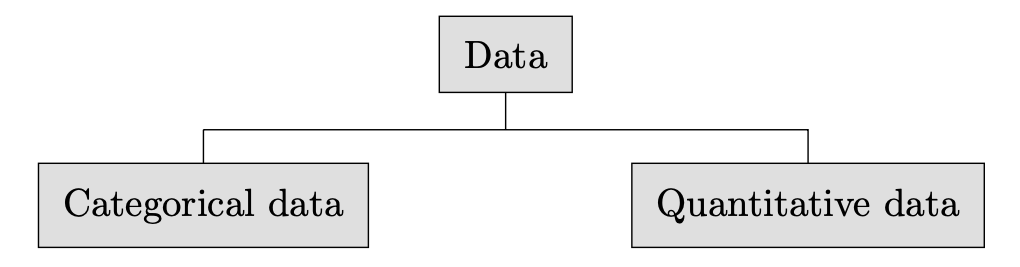
Data that are non-numeric or qualitative in nature, and that can be classified into different categories; are called Categorical Data. For example, question 2 of the survey asked the respondents, “What are some issues, if at all, in your neighborhood that concerns you the most?” It provided the respondents with nine non-numeric options to choose from,
Lack of proper waste disposal system
Air Pollution
Access to healthy drinking water
Lack of green spaces/ parks/ playground
Availability of healthcare system
Risk of flooding/ forest fire
Access to grocery stores/ neighborhood market
Unsafe road conditions
Others
Each response forms a category; hence, question 2 collected categorical data.
Data that are numeric in nature and hence quantifiable, are called quantitative data. Question 7 in the survey asked the respondents, “How many people live in your household?” Such variables “Number of people” would record data that are numbers; hence are called quantitative data.
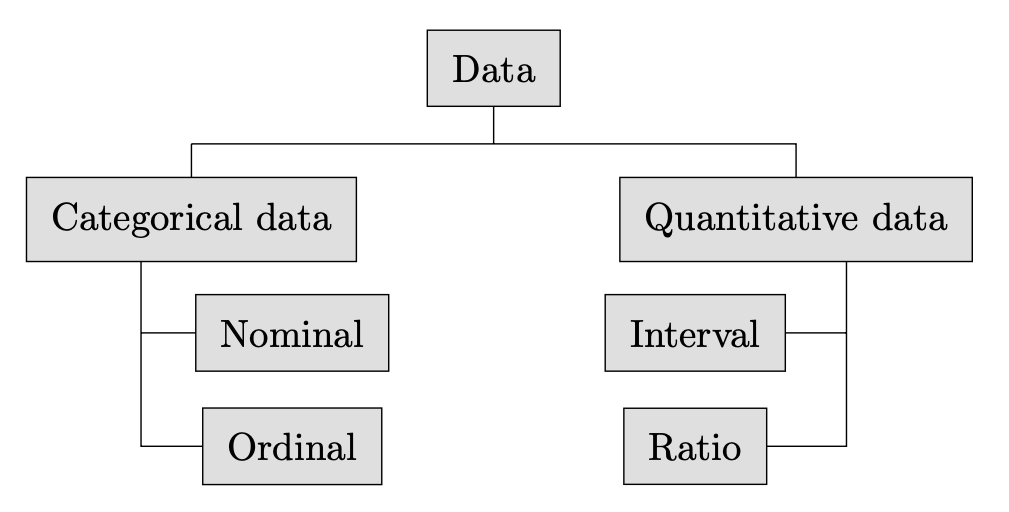
Categorical data can further be classified into two types: nominal data and ordinal data.
Let us refocus on Question 2 of the survey, “What are some issues, if at all, in your neighborhood that concerns you the most?” The question provided the respondents with nine non-numeric options,
Lack of proper waste disposal system
Air Pollution
Access to healthy drinking water
Lack of green spaces/ parks/ playground
Availability of healthcare system
Risk of flooding/ forest fire
Access to grocery stores/ neighborhood market
Unsafe road conditions
Others
These nine options form nine categories whose order is not essential. Such qualitative data, which can be classified into different categories, but the order of the categories is not important, are called Nominal Data.
Nominal data can be counted and hence it can be used to calculate the number of times or the percentage of times a particular category has been selected. No other meaningful mathematical operations can be performed on Nominal Data.
Categorical data, where the order of the categories is important, is called Ordinal data. Question 10 of the survey asked the respondents, “How satisfied are you with your local government’s initiatives to address issues present in your community?” It provided the respondents with five non-numeric options: Extremely satisfied, satisfied, Average, Dissatisfied, and Extremely Dissatisfied. Here, the five options create five categories, and there exists a natural ordering between these categories. Hence such data is Ordinal in nature.
Like nominal data, you can count ordinal data and use them to calculate the number of times or the percentage of times a particular category has been selected. However, some disagreement exists about whether you can perform any other mathematical operations, especially calculate the average, with Ordinal Data. When Ordinal data is in non-numeric form, you cannot calculate its average and measure the average response of the respondents. However, sometimes numbers are assigned to the different categories of Ordinal data for easier data entry and analysis (5: Extremely satisfied, 4: satisfied, 3: Average, 2: Dissatisfied, and 1: Extremely Dissatisfied). Although these numbers do not have any true mathematical value, you can often use these numbers to calculate the average response under the assumption that the difference in degree between consecutive categories is approximately equal.
Quantitative data can also be classified into two types: interval and ratio data.
Let us start with an example. Question 4 of the survey asked the respondents, “At what time do you experience the heaviest traffic in your neighborhood? Imagine how a respondent would respond to that question? 7:30 AM? 8 AM? All the responses will record the time of the day. Such data is numerical and will be classified as Interval Data.
Interval data are numerical, and as a result, the interval between the consecutive points of measurement are uniform. Whether someone experiences the heaviest traffic at 8 AM or 8:30 AM, or 9 AM, the difference between all the three timings is consistently 30 minutes or .5 hours.
Since interval data is numeric, you can perform any mathematical operation, but interval data does not have any meaningful zero. For example, suppose Sunday at midnight, there was an accident in your neighborhood, and as a result, there was massive traffic in your neighborhood. One way to measure the timing is through a 24-hour clock and say that your neighborhood experienced unusual traffic at 0:00 AM on Sunday. Here zero does not mean that there is an absence of time. Zero is just the measure of the time of the day using a 24-hour clock.
To understand Ratio Data, let us get back to question 7, where the survey asked the respondents, “How many people live in your household?” Unlike Interval data, in this question, if you say that zero people live in the household, it means that no people live in the household. So, in Ratio data, the value zero indicates an absence of a measure.
Like interval data, ratio data is numeric in nature. Hence, the interval between the consecutive points of measurement is uniform, and you can perform any mathematical operations on it.
Subsection 2.5.2
Checkpoint 2.5.4.
Go to the survey in Figure 2.5.2, and identify the survey questions that gather data of the following types:
Quantitative
Nominal
Ratio
Interval
Categorical
Ordinal