
Exercises 4.11 Exercises
Subsection 4.11.1 Geometry Exercises
Exercise Group.
(Squaretopia grid and challenges are adapted from “Gerrymandering in Squaretopia”, an exercise created by and licensed to the Metric Geometry and Gerrymandering Group)
Squaretopia consists of 90 blocks: 54 vote for the Heart (\(\heartsuit \)) party and 36 vote for the Club (\(\clubsuit \)) party. Consider the following challenges that reveal the power of “cracking” and “packing” districts.
1.
The grid is to be divided into 10 districts that must be contiguous and contain an equal number of voters.
What is the minimum number of voters needed to win all 10 districts?
What is the maximum number of districts that can be won by the Heart party? (Mathematically, not based on location of voters.)
What is the maximum number of districts that can be won by the Club party? (Mathematically, not based on location of voters.)
2. Challenge 1: Compactness.
Divide Squaretopia (given below in Table 4.11.1) into 10 equal districts that are as “compact” as possible. How many districts does the Heart party win?
\(\heartsuit \)
\(\heartsuit \)
\(\clubsuit \)
\(\clubsuit \)
\(\clubsuit \)
\(\clubsuit \)
\(\clubsuit \)
\(\clubsuit \)
\(\heartsuit \)
\(\heartsuit \)
\(\heartsuit \)
\(\heartsuit \)
\(\heartsuit \)
\(\heartsuit \)
\(\heartsuit \)
\(\heartsuit \)
\(\heartsuit \)
\(\heartsuit \)
\(\heartsuit \)
\(\clubsuit \)
\(\clubsuit \)
\(\heartsuit \)
\(\clubsuit \)
\(\clubsuit \)
\(\clubsuit \)
\(\heartsuit \)
\(\heartsuit \)
\(\heartsuit \)
\(\clubsuit \)
\(\clubsuit \)
\(\heartsuit \)
\(\clubsuit \)
\(\clubsuit \)
\(\heartsuit \)
\(\heartsuit \)
\(\clubsuit \)
\(\clubsuit \)
\(\clubsuit \)
\(\heartsuit \)
\(\heartsuit \)
\(\clubsuit \)
\(\clubsuit \)
\(\heartsuit \)
\(\heartsuit \)
\(\heartsuit \)
\(\heartsuit \)
\(\heartsuit \)
\(\clubsuit \)
\(\heartsuit \)
\(\clubsuit \)
\(\clubsuit \)
\(\heartsuit \)
\(\heartsuit \)
\(\heartsuit \)
\(\clubsuit \)
\(\heartsuit \)
\(\heartsuit \)
\(\heartsuit \)
\(\heartsuit \)
\(\clubsuit \)
\(\clubsuit \)
\(\heartsuit \)
\(\clubsuit \)
\(\clubsuit \)
\(\clubsuit \)
\(\heartsuit \)
\(\clubsuit \)
\(\heartsuit \)
\(\heartsuit \)
\(\heartsuit \)
\(\clubsuit \)
\(\heartsuit \)
\(\clubsuit \)
\(\heartsuit \)
\(\heartsuit \)
\(\heartsuit \)
\(\heartsuit \)
\(\heartsuit \)
\(\heartsuit \)
\(\clubsuit \)
\(\heartsuit \)
\(\heartsuit \)
\(\heartsuit \)
\(\heartsuit \)
\(\clubsuit \)
\(\clubsuit \)
\(\heartsuit \)
\(\heartsuit \)
\(\heartsuit \)
\(\clubsuit \)
3. Challenge 2: Proportionality.
Divide Squaretopia into 10 equal districts so that Heart's seat share is proportional to its overall vote share. Try to keep the districts as “compact” as possible.
\(\heartsuit \)
\(\heartsuit \)
\(\clubsuit \)
\(\clubsuit \)
\(\clubsuit \)
\(\clubsuit \)
\(\clubsuit \)
\(\clubsuit \)
\(\heartsuit \)
\(\heartsuit \)
\(\heartsuit \)
\(\heartsuit \)
\(\heartsuit \)
\(\heartsuit \)
\(\heartsuit \)
\(\heartsuit \)
\(\heartsuit \)
\(\heartsuit \)
\(\heartsuit \)
\(\clubsuit \)
\(\clubsuit \)
\(\heartsuit \)
\(\clubsuit \)
\(\clubsuit \)
\(\clubsuit \)
\(\heartsuit \)
\(\heartsuit \)
\(\heartsuit \)
\(\clubsuit \)
\(\clubsuit \)
\(\heartsuit \)
\(\clubsuit \)
\(\clubsuit \)
\(\heartsuit \)
\(\heartsuit \)
\(\clubsuit \)
\(\clubsuit \)
\(\clubsuit \)
\(\heartsuit \)
\(\heartsuit \)
\(\clubsuit \)
\(\clubsuit \)
\(\heartsuit \)
\(\heartsuit \)
\(\heartsuit \)
\(\heartsuit \)
\(\heartsuit \)
\(\clubsuit \)
\(\heartsuit \)
\(\clubsuit \)
\(\clubsuit \)
\(\heartsuit \)
\(\heartsuit \)
\(\heartsuit \)
\(\clubsuit \)
\(\heartsuit \)
\(\heartsuit \)
\(\heartsuit \)
\(\heartsuit \)
\(\clubsuit \)
\(\clubsuit \)
\(\heartsuit \)
\(\clubsuit \)
\(\clubsuit \)
\(\clubsuit \)
\(\heartsuit \)
\(\clubsuit \)
\(\heartsuit \)
\(\heartsuit \)
\(\heartsuit \)
\(\clubsuit \)
\(\heartsuit \)
\(\clubsuit \)
\(\heartsuit \)
\(\heartsuit \)
\(\heartsuit \)
\(\heartsuit \)
\(\heartsuit \)
\(\heartsuit \)
\(\clubsuit \)
\(\heartsuit \)
\(\heartsuit \)
\(\heartsuit \)
\(\heartsuit \)
\(\clubsuit \)
\(\clubsuit \)
\(\heartsuit \)
\(\heartsuit \)
\(\heartsuit \)
\(\clubsuit \)
4. Challenge 3: Gerrymander for Hearts.
Divide Squaretopia into 10 equal districts so that the Heart party wins as many districts as possible. Try to keep the districts as “compact” as possible. How many districts does the Heart party win?
\(\heartsuit \)
\(\heartsuit \)
\(\clubsuit \)
\(\clubsuit \)
\(\clubsuit \)
\(\clubsuit \)
\(\clubsuit \)
\(\clubsuit \)
\(\heartsuit \)
\(\heartsuit \)
\(\heartsuit \)
\(\heartsuit \)
\(\heartsuit \)
\(\heartsuit \)
\(\heartsuit \)
\(\heartsuit \)
\(\heartsuit \)
\(\heartsuit \)
\(\heartsuit \)
\(\clubsuit \)
\(\clubsuit \)
\(\heartsuit \)
\(\clubsuit \)
\(\clubsuit \)
\(\clubsuit \)
\(\heartsuit \)
\(\heartsuit \)
\(\heartsuit \)
\(\clubsuit \)
\(\clubsuit \)
\(\heartsuit \)
\(\clubsuit \)
\(\clubsuit \)
\(\heartsuit \)
\(\heartsuit \)
\(\clubsuit \)
\(\clubsuit \)
\(\clubsuit \)
\(\heartsuit \)
\(\heartsuit \)
\(\clubsuit \)
\(\clubsuit \)
\(\heartsuit \)
\(\heartsuit \)
\(\heartsuit \)
\(\heartsuit \)
\(\heartsuit \)
\(\clubsuit \)
\(\heartsuit \)
\(\clubsuit \)
\(\clubsuit \)
\(\heartsuit \)
\(\heartsuit \)
\(\heartsuit \)
\(\clubsuit \)
\(\heartsuit \)
\(\heartsuit \)
\(\heartsuit \)
\(\heartsuit \)
\(\clubsuit \)
\(\clubsuit \)
\(\heartsuit \)
\(\clubsuit \)
\(\clubsuit \)
\(\clubsuit \)
\(\heartsuit \)
\(\clubsuit \)
\(\heartsuit \)
\(\heartsuit \)
\(\heartsuit \)
\(\clubsuit \)
\(\heartsuit \)
\(\clubsuit \)
\(\heartsuit \)
\(\heartsuit \)
\(\heartsuit \)
\(\heartsuit \)
\(\heartsuit \)
\(\heartsuit \)
\(\clubsuit \)
\(\heartsuit \)
\(\heartsuit \)
\(\heartsuit \)
\(\heartsuit \)
\(\clubsuit \)
\(\clubsuit \)
\(\heartsuit \)
\(\heartsuit \)
\(\heartsuit \)
\(\clubsuit \)
5. Challenge 4: Gerrymander for Clubs.
Divide Squaretopia into 10 equal districts so that the Heart party wins as few districts as possible. Try to keep the districts as “compact” as possible. How many districts does the Heart party win?
\(\heartsuit \)
\(\heartsuit \)
\(\clubsuit \)
\(\clubsuit \)
\(\clubsuit \)
\(\clubsuit \)
\(\clubsuit \)
\(\clubsuit \)
\(\heartsuit \)
\(\heartsuit \)
\(\heartsuit \)
\(\heartsuit \)
\(\heartsuit \)
\(\heartsuit \)
\(\heartsuit \)
\(\heartsuit \)
\(\heartsuit \)
\(\heartsuit \)
\(\heartsuit \)
\(\clubsuit \)
\(\clubsuit \)
\(\heartsuit \)
\(\clubsuit \)
\(\clubsuit \)
\(\clubsuit \)
\(\heartsuit \)
\(\heartsuit \)
\(\heartsuit \)
\(\clubsuit \)
\(\clubsuit \)
\(\heartsuit \)
\(\clubsuit \)
\(\clubsuit \)
\(\heartsuit \)
\(\heartsuit \)
\(\clubsuit \)
\(\clubsuit \)
\(\clubsuit \)
\(\heartsuit \)
\(\heartsuit \)
\(\clubsuit \)
\(\clubsuit \)
\(\heartsuit \)
\(\heartsuit \)
\(\heartsuit \)
\(\heartsuit \)
\(\heartsuit \)
\(\clubsuit \)
\(\heartsuit \)
\(\clubsuit \)
\(\clubsuit \)
\(\heartsuit \)
\(\heartsuit \)
\(\heartsuit \)
\(\clubsuit \)
\(\heartsuit \)
\(\heartsuit \)
\(\heartsuit \)
\(\heartsuit \)
\(\clubsuit \)
\(\clubsuit \)
\(\heartsuit \)
\(\clubsuit \)
\(\clubsuit \)
\(\clubsuit \)
\(\heartsuit \)
\(\clubsuit \)
\(\heartsuit \)
\(\heartsuit \)
\(\heartsuit \)
\(\clubsuit \)
\(\heartsuit \)
\(\clubsuit \)
\(\heartsuit \)
\(\heartsuit \)
\(\heartsuit \)
\(\heartsuit \)
\(\heartsuit \)
\(\heartsuit \)
\(\clubsuit \)
\(\heartsuit \)
\(\heartsuit \)
\(\heartsuit \)
\(\heartsuit \)
\(\clubsuit \)
\(\clubsuit \)
\(\heartsuit \)
\(\heartsuit \)
\(\heartsuit \)
\(\clubsuit \)
6.
When using grid examples, it is often easy for populations to be equal in every district, but on real maps, some deviation is allowed. The population deviation of a district plan is the percentage difference between the most populous and least populous districts, relative to the ideal population (the population if all districts were equal).
For example, suppose a state with 1,000,000 people was divided into 10 districts. The most populous district contains 102,300 people and the least populous district contains 98,400 people. This means that the ideal population is 100,000 and the population deviation is 3.9%.
\(\frac{102,300-98,400}{100,000}=.039=3.9\%\)Courts have dictated that the maximum allowed population deviation is 0.75% for congressional plans and 10% for state legislative plans.
-
Suppose a state is planning to create new congressional districts and proposes a plan in which their 3 districts have the following populations:
District #1: 232,934
District #2: 231,956
District #3: 231,158
Calculate the ideal population and the population deviation for this plan. Would this proposal be allowed to move forward based on population alone?
-
Suppose a state with a population of 2,300,000 is set to create new district plans for 8 congressional districts and 40 state legislative districts
The congressional proposal's least populous district has a population of 286,790. What is the maximum population allowed for another district?
The state legislative proposal's most populous district has a population of 59,440. What is the minimum population allowed for another district?
Exercise Group.
The grid below represents a districting plan.
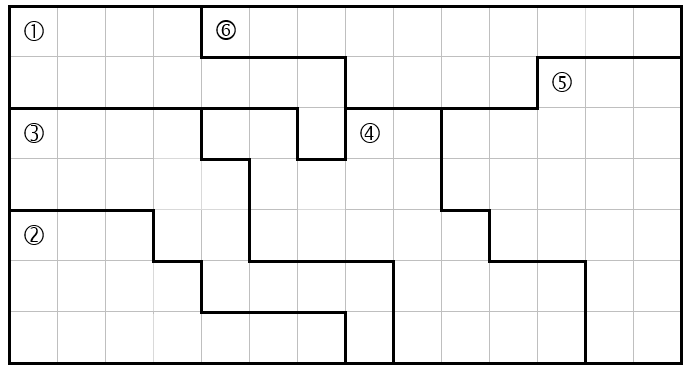
7.
Calculate the Reock score for each district.
8.
Calculate the Polsby-Popper score for each district.
9.
Calculate the Convex Hull score for each district.
10.
For each statement, explain why the statement is not an appropriate interpretation of compactness scores.
The average Polsby-Popper score of districts in Maryland is 0.115, thus the districts are not compact.
The Reock score of Massachusetts' 6th district is 0.45 while the Reock score of its 5th district is 0.23, thus the 6th district is more compact.
The average Polsby-Popper score of New Jersey's congressional districts is 0.20 while the average Polsby-Popper score of Pennsylvania's congressional districts is 0.33, thus Pennsylvania is more compact.
Subsection 4.11.2 Partisan Gerrymandering Exercises
11. Efficiency Gap.
The grid below represents a districting plan. Note that \(\heartsuit_2 = 2 \) voters for \(\heartsuit \text{,}\) and \(\clubsuit = 1 \) voter for \(\clubsuit \text{.}\)
| \(\heartsuit_2 \) | \(\heartsuit \) | \(\clubsuit_3 \) | \(\clubsuit_2 \) | \(\heartsuit \) | \(\clubsuit \) | \(\heartsuit \) |
| \(\clubsuit \) | \(\clubsuit \) | \(\heartsuit_2 \) | \(\heartsuit \) | \(\clubsuit \) | \(\clubsuit_2 \) | \(\clubsuit_2 \) |
| \(\clubsuit_2 \) | \(\heartsuit \) | \(\clubsuit \) | \(\clubsuit \) | \(\heartsuit_4 \) | \(\clubsuit \) | \(\heartsuit \) |
| \(\clubsuit \) | \(\heartsuit \) | \(\clubsuit \) | \(\heartsuit_3 \) | \(\heartsuit_3 \) | \(\heartsuit_2 \) | \(\clubsuit \) |
| \(\clubsuit_2 \) | \(\heartsuit \) | \(\clubsuit_2 \) | \(\heartsuit_2 \) | \(\heartsuit_2 \) | \(\clubsuit \) | \(\clubsuit \) |
| \(\clubsuit_3 \) | \(\heartsuit \) | \(\clubsuit_3 \) | \(\clubsuit_3 \) | \(\clubsuit \) | \(\clubsuit \) | \(\heartsuit \) |
| \(\clubsuit_2 \) | \(\clubsuit_2 \) | \(\clubsuit \) | \(\heartsuit \) | \(\heartsuit \) | \(\heartsuit \) | \(\clubsuit \) |
Calculate vote totals for each district.
Calculate wasted vote totals for each district.
Compute the efficiency gap.
Interpret the efficiency gap answer. Which party holds the advantage in this plan? How significant is their advantage?
12.
There is an alternative “shortcut” formula to calculate the efficiency gap in a districting plan:
Efficiency Gap = (% of Districts won \(-\) 50%) \(-\) 2 * (% of Votes \(-\) 50%)
For example, in the district plan in Example 1.6.1 (given in Table 4.6.2), Heart wins 3/5 = 60% of districts and has 26/45 = 57.8% of voters.
Using the formula: Efficiency Gap = (60% \(-\) 50%) \(-\) 2 * (57.8% \(-\) 50%) = \(-5.6\)%. Since we used values for Heart, the negative number here represents that the Club party holds the advantage in this map.
Note: This answer is slightly different from the original calculation due to rounding error and the fact that our grid districts needed at least 5/9 = 55.6% of voters to win (rather than 50% +1 vote).
Use this alternative formula to calculate and interpret the efficiency gap in Exercise 4.11.11. Are your answers closeWindow()?
Suppose a party has 60% of votes on an entire map. The “most fair” outcome according to the efficiency gap formula is that this party wins what percentage of districts? What does your answer tell you about the efficiency gap formula and proportionality?
13. Efficiency Gap and Mean-Median.
The tables below show the results of the North Carolina congressional elections in 2018 (prior to the state ruling that partisan gerrymandering is illegal, forcing a new map to be drawn and used) and 2020. For purposes of calculations, assume that an equal number of people voted in each district. NOTE: Do not include the 100-0 districts in the calculations as candidates ran unopposed, so it does not make sense to say votes are “wasted” when voters did not have a choice on candidates.

(a)
Calculate and interpret the efficiency gap for each set of election results. Does either district plan give more than a +2 seat advantage to the Republicans? (Reminder: Do not include the 100-0 districts in the calculations.)
(b)
Calculate and interpret the Mean-Median Difference for each set of election results. Do the elections show a significant partisan bias to the Republicans under each district plan? (Again, do not include 100-0 districts in the calculations.) Use the calculator below to compute standard deviation and find \(t\text{.}\)
14.
Explore the Gerryminder redistricting simulation Gerryminder: A Redistricting Game (opens a new tab) 1 .
(a)
Adjust the district boundaries to get each district to ideal size.
(b)
Consider the seats-to-votes ratio calculation. If the election outcome (seats) is proportional to voter party (votes), what number will the seats-to-votes ratio be closeWindow() to?
Subsection 4.11.3 Racial Gerrymandering Exercises
15.
(a)
Suppose a voting precinct has \(80 \%\) White voters and in a recent election, \(75 \% \) of voters in the precinct supported a Heart (\(\heartsuit \)) party candidate. What is the maximum and minimum percentage of White voters that could have voted for the Heart candidate in the district? Complete the tables below.
| maximum White for \(\heartsuit \) | |||
| \(\heartsuit \) votes | \(\clubsuit \) votes | total | |
| White | 80 | ||
| non-White | |||
| total | 75 | 100 | |
| minimum White for \(\heartsuit \) | |||
| \(\heartsuit \) votes | \(\clubsuit \) votes | total | |
| White | 80 | ||
| non-White | |||
| total | 75 | 100 | |
maximum White for \(\heartsuit = \; \; \; \; /80 = \; \; \; \%\)
minimum White for \(\heartsuit = \; \; \; \; /80 = \; \; \; \%\)
(b)
Suppose a voting precinct has \(68 \%\) Hispanic voters and in a recent election, \(36 \% \) of voters in the precinct supported a Heart (\(\heartsuit \)) party candidate. What is the maximum and minimum percentage of Hispanic voters that could have voted for the Heart candidate in the precinct? Complete the tables below.
| maximum Hispanic for \(\heartsuit \) | |||
| \(\heartsuit \) votes | \(\clubsuit \) votes | total | |
| Hispanic | 68 | ||
| non-Hispanic | |||
| total | 36 | 100 | |
| minimum Hispanic for \(\heartsuit \) | |||
| \(\heartsuit \) votes | \(\clubsuit \) votes | total | |
| Hispanic | 68 | ||
| non-Hispanic | |||
| total | 36 | 100 | |
maximum Hispanic for \(\heartsuit = \; \; \; \; /68 = \; \; \; \%\)
minimum Hispanic for \(\heartsuit = \; \; \; \; /68 = \; \; \; \%\)
16.
Suppose we collected data from all precincts from the scenarios in the previous exercise, then created a scatterplot and found the line of best fit.
(a)
We obtain the following regression line equation for the relationship between White voters and Heart voters among precincts in a district:
Using the equation above, what percentage of votes would you predict that Heart would receive from a precinct with all White voters?
(b)
We obtain the following regression line equation for the relationship between Hispanic voters and Heart voters among precincts in a district:
Using the equation above, what percentage of votes would you predict that Heart would receive from a precinct with all Hispanic voters?
(c)
Do the answers above suggest racially polarized voting among White and Hispanic voters in this particular district? Explain.
17.
Use the MGGG 5x5 grid interactive tool (opens new tab) 2 to answer the following questions.
Place 9 Hearts in the center of the grid and 16 Clubs around the outside. Given that there are 5 districts of 5 voters each, do you think it is more likely that Hearts wins 0 districts or 3 districts? Test this by creating an example of each scenario and comparing the bar graphs of results.
Now place 9 Hearts on the border of the grid and use Clubs for the remaining 16 positions. Does this position of Hearts make it easier or harder for them to win districts compared to clustering them in the center (in the previous question)? Use the bar graphs to support your answer.
18.
Use the MGGG 7x7 grid interactive tool (opens new tab) 3 to answer the following questions.
Even though the 7x7 grid is only roughly double the amount of spaces as a 5x5 grid, the number of possible district plans vastly increases. While it might not be practical to consider all possibilities, we can use the grid simulation to take a sample of possible district plans and obtain a distribution of results (similar to the previous exercise) among the sample.
Create a valid district plan (7 districts of 7 voters each) with exactly 22 Hearts in which Hearts wins 4 out of 7 districts. Is your plan an outlier for the distribution of voters that you chose? Use the “sample with MCMC” button to create a bar graph of results. What happens when you change nothing on your district plan but click the sample button again?
Change your district plan by changing 4 Hearts to Clubs which do not change the outcome of any district. You should now have exactly 18 Hearts and a plan in which Hearts wins 4 out of 7 districts. Is your plan an outlier for the distribution of voters that you chose?
Create multiple grids of exactly 18 Hearts but arrange the Hearts in different ways. For example, you might arrange them together in one large group, in two groups in opposite corners, or randomly scattered in the grid. For each arrangement, create the distribution of districts won by Hearts. Are there certain arrangements of the 18 Hearts that tend to result in winning more districts?
phobos.ramapo.edu/~jteigen/gerry.htmlmggg.org/metagraph/5x5.htmlmggg.org/metagraph/7x7.html