
Exercises 2.9 Exercises
1.
Interpret the bar chart given in Figure 2.9.1 on distribution of number of days from positive COVID confirmation to clinical recovery.
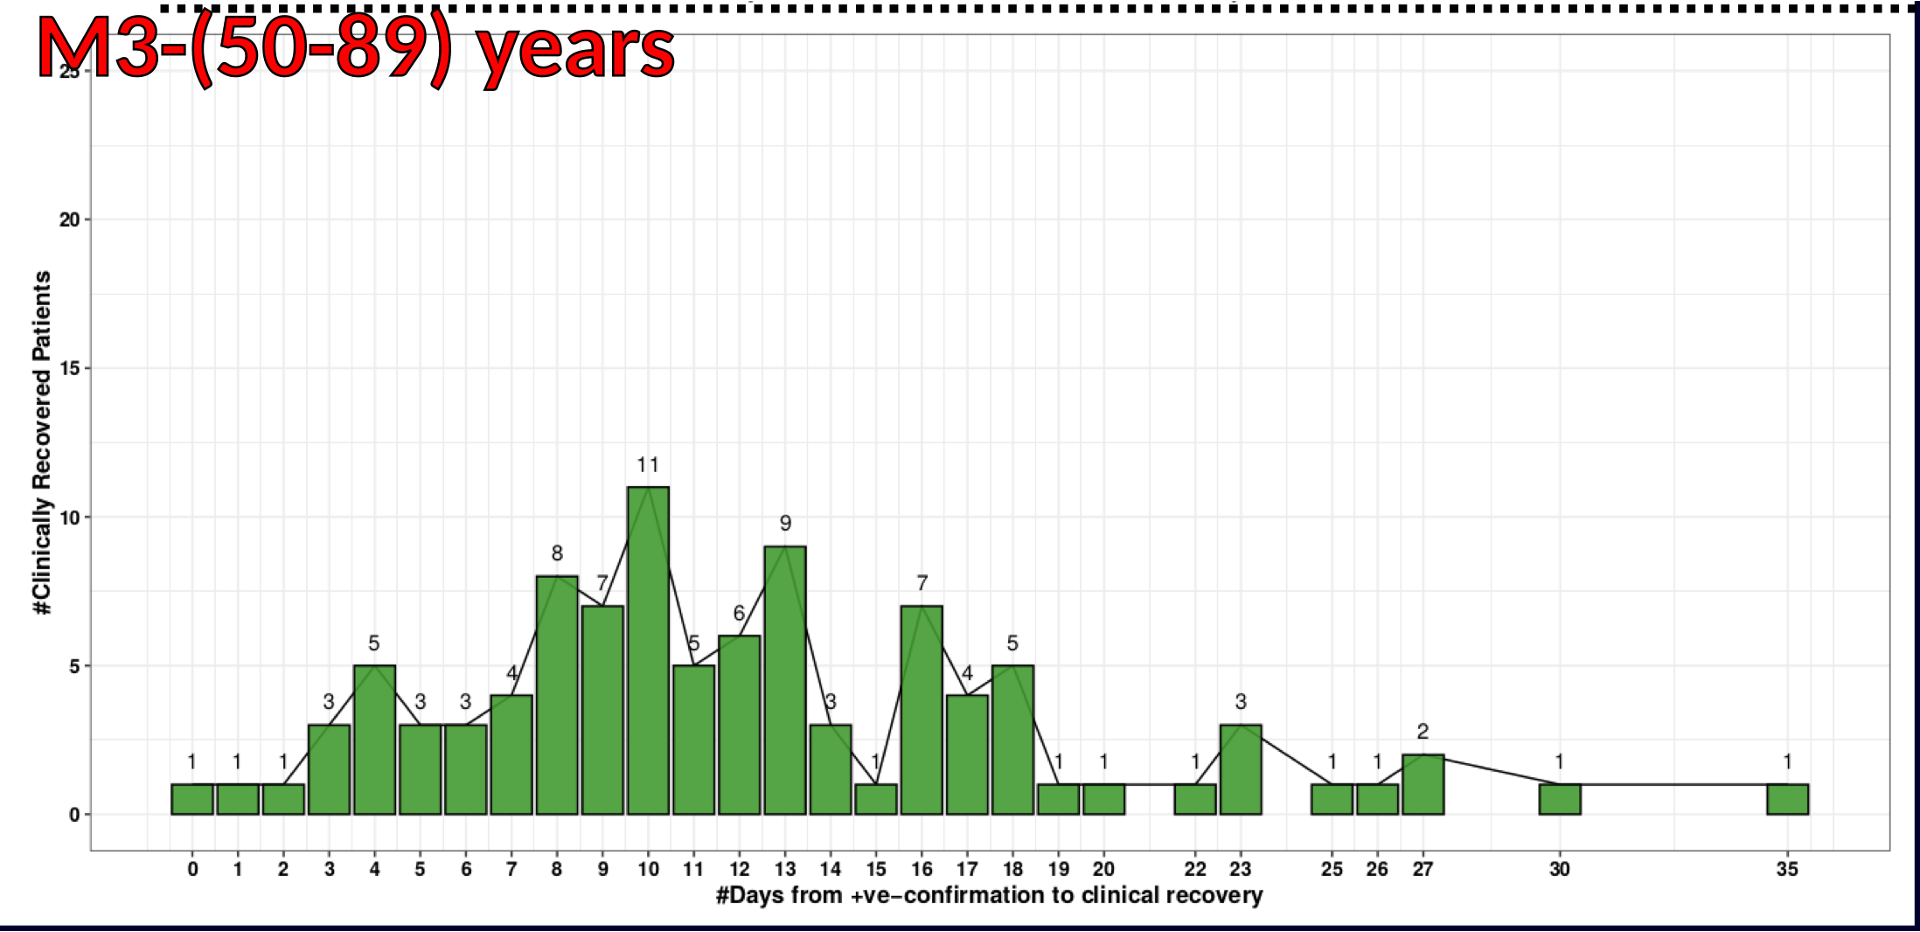
How many people recovered in four days?
How many people took twenty-three days to recover?
How many people took eight to thirteen days to recover?
Is there any potential outlier?
2.
Go to the data set Households by total money income [Microsoft Excel Document] 1 . The data set has been taken from [2.10.1.19] and simplified for the lesson.
How has the estimated median income (dollar) of white people changed from 2002 to 2020?
How has the estimated median income (dollar) of black people changed from 2002 to 2020?
What visualization would be most appropriate to explore the change of the estimated median income over the years?
Make at least two interpretations from the visualizations about the change of the white and black people's estimated median income.
3.
Go to the data set Households by total money income [Microsoft Excel Document] 2 . The data set has been taken from [2.10.1.19] and simplified for the lesson.
Compare the estimated median income (dollar) of the White, Black, Asian, and Hispanic people from 2002 to 2020.
What visualization would be most appropriate to compare the estimated median income of the four racial groups?
Make at least two interpretations from the visualization(s) and report how the estimated median income of one racial group is different from others.
4.
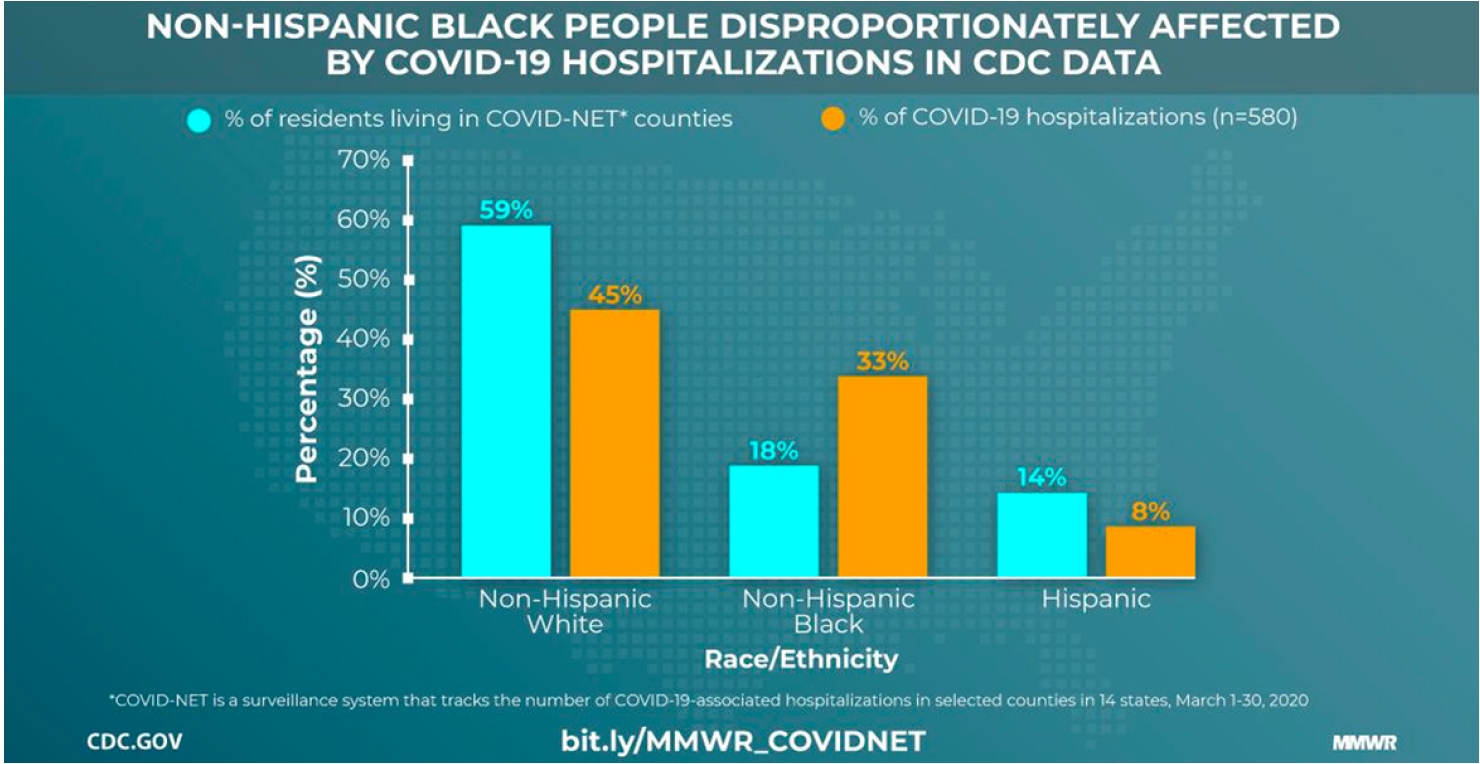
Interpret the bar graph given in Figure 2.9.2 on COVID-19 hospitalizations, broken down by race/ethnicity.
5.
Interpret the bar graph in Figure 2.9.3 on COVID-19 vaccine doses as claimed by different countries and answer the following questions:
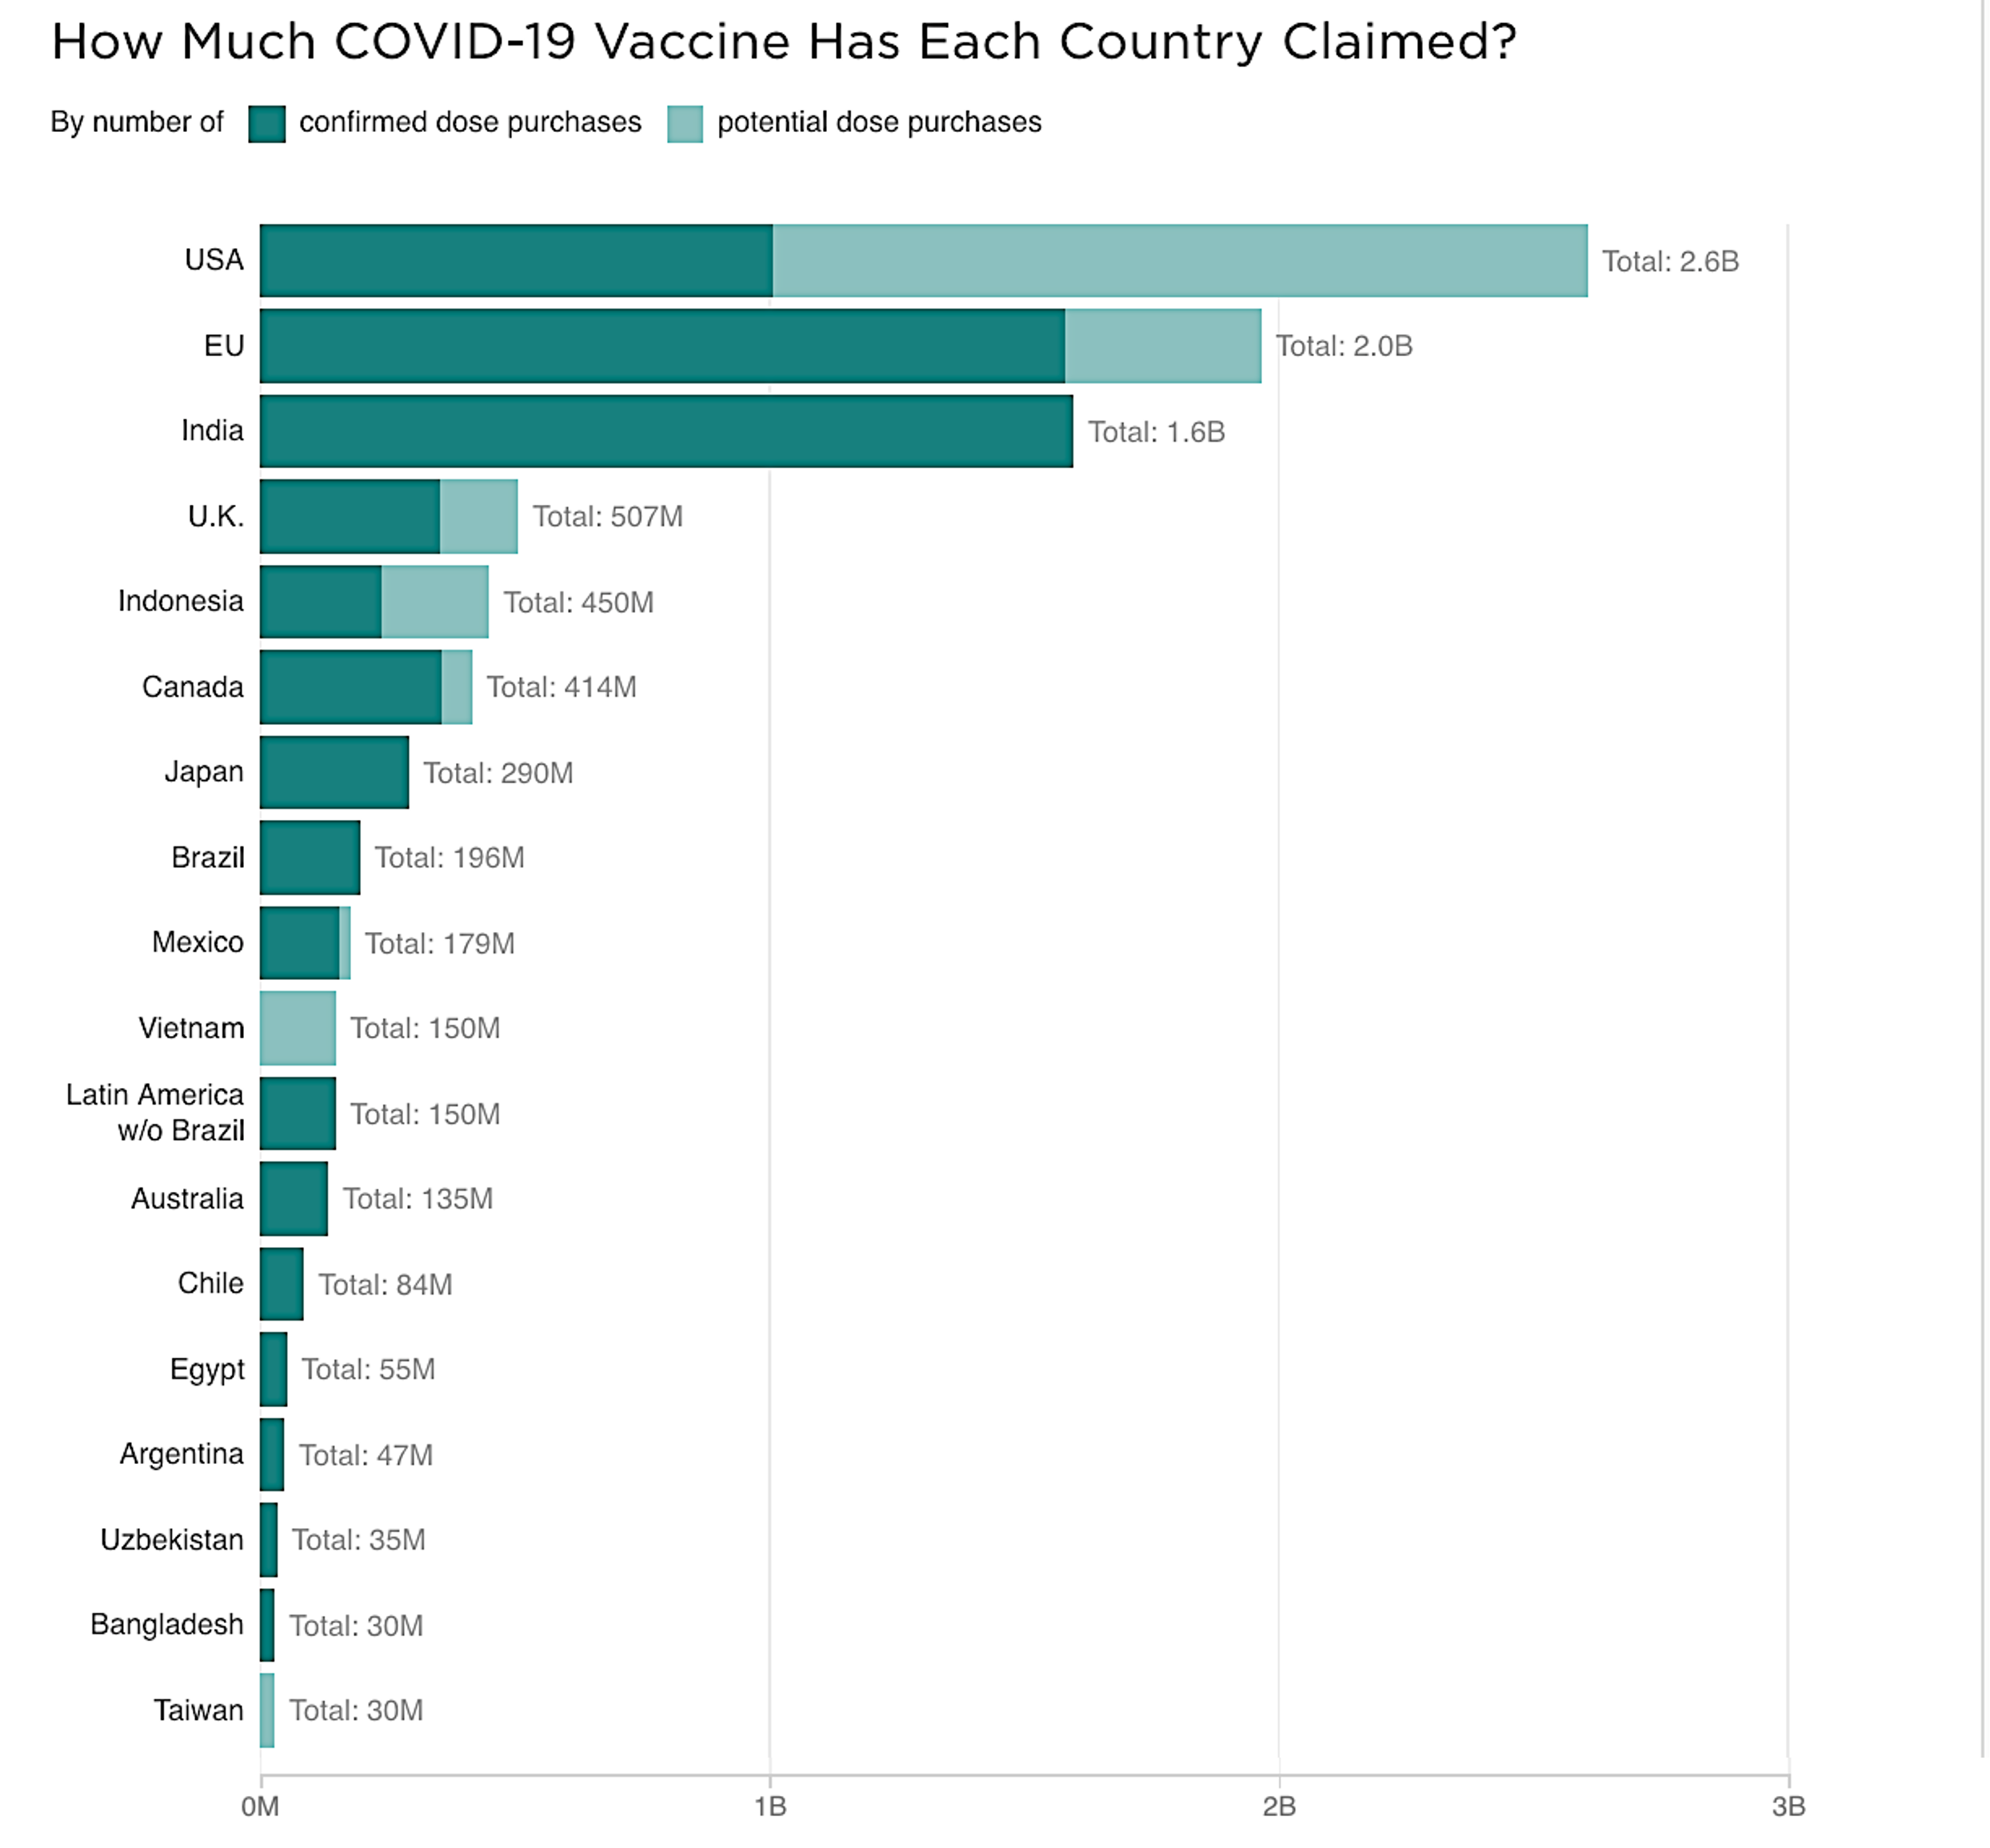
Which country has definitively purchased the maximum number of COVID vaccine doses?
Which country is speculated to have contained the maximum number of CODID vaccine doses?
The total population of the USA is approximately 328 million. If the USA contains 2.6 billion vaccine doses, how many times can it vaccinate its population, if most COVID vaccines require individuals to take two doses to protect themselves from the virus?
The total population of Canada is approximately 38 million. If Canada contains 414 million vaccine doses, how many times can it vaccinate its population, if most COVID vaccines require individuals to take two doses to protect themselves from the virus?
environmental-racism/data/environmental-racism-census.xlsxenvironmental-racism/data/environmental-racism-census.xlsx