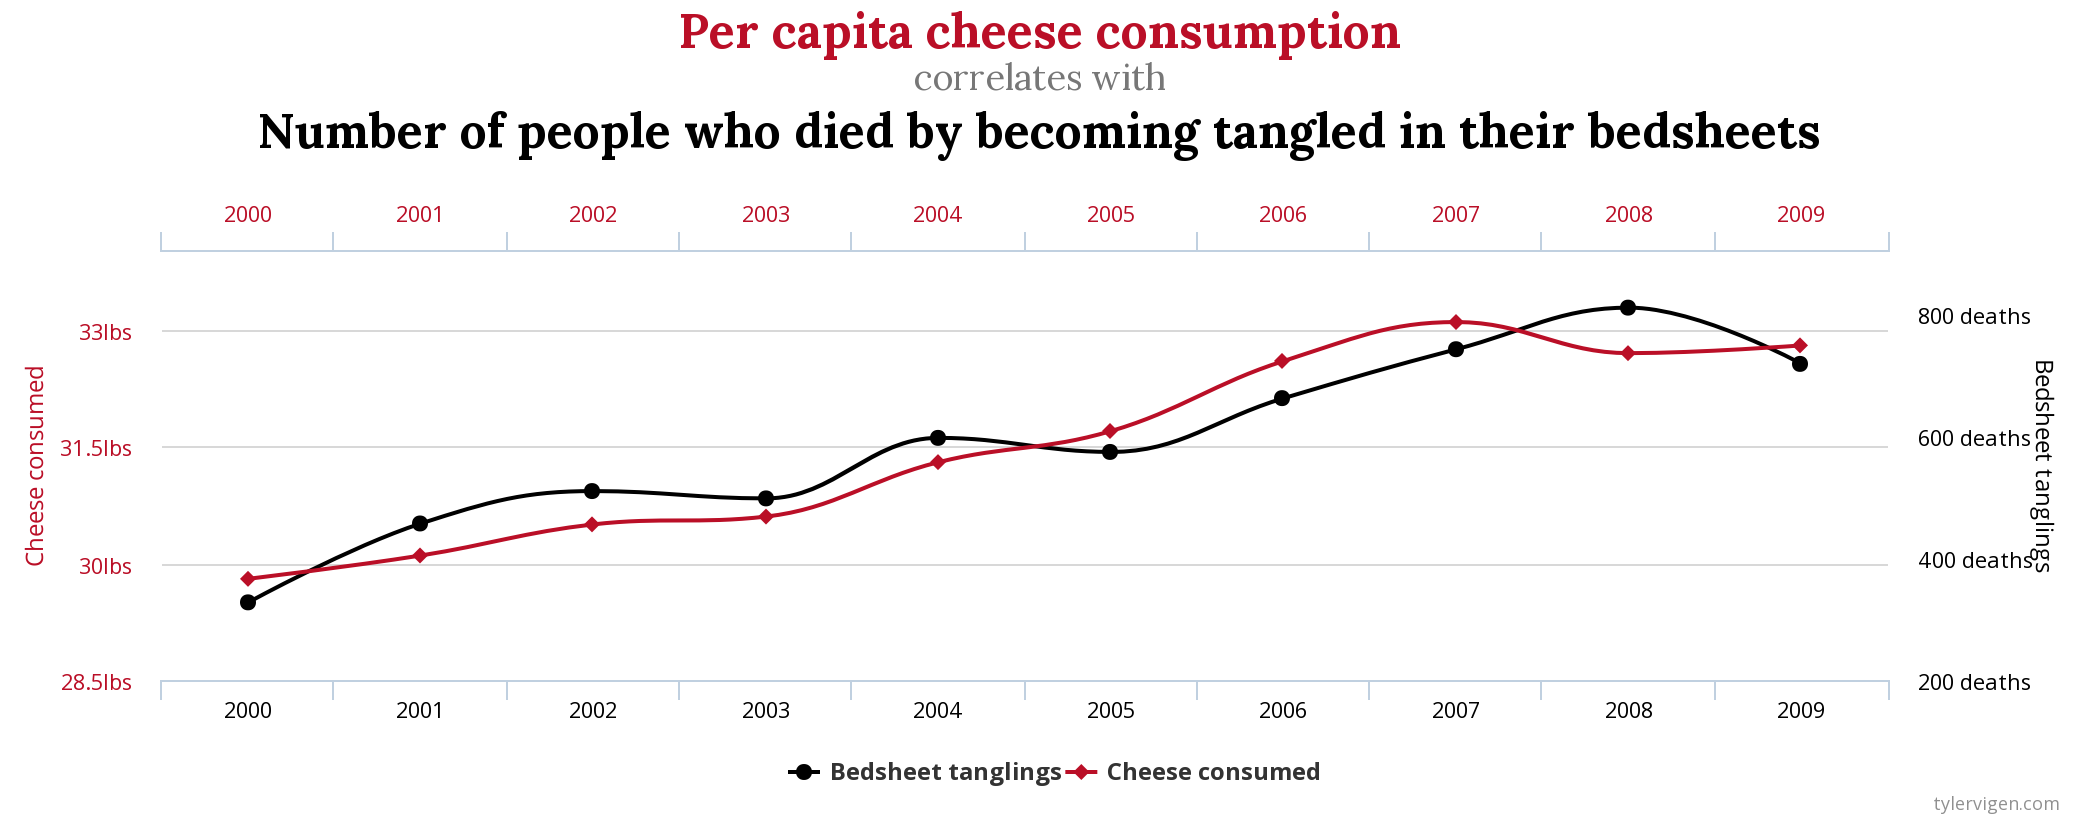
Reading Questions 3.8 Reading Questions

1.

Have you ever mistakenly saw a coincidence as evidence for a connection between two events?

2.

Consider a spurious correlation: in the United States, between 2000 and 2009, the number of people who died by becoming tangled in their bedsheets in a year was highly correlated with the amount of cheese consumed that year such that more deaths in a year was associated with more cheese consumption.

Figure 3.8.1. Correlation between the consumption of cheese and the number of people who die by getting tangled in their bedsheets. Image CC-BY-4 1  by Tyler Vigen [3.10.1.29].

Can you think of an explanation for this correlation? Imagine the opposite was found such that the number of people who died from becoming tangled in bedsheets was lower when cheese consumption was higher. Can you come up with an explanation for that result? How easy is it explain any spurious correlation?

3.

Do graphs make a claim seem more likely to be true? Why or why not?

4.

When you see quantitative information used in claims online, what are some things you can look for to indicate that the claim might be misleading? Working as a group, come up with a list of questions that readers should ask about quantitative information they see online.

creativecommons.org/licenses/by/4.0/