Every day children of all ages, from preschool to high school, get disciplined at school. The form of discipline varies, from being sent to the principal’s office all the way to being arrested or expelled. Who gets disciplined at school, and for which offenses and behaviors? Are offenses and punishments getting better or worse? And what is the phenomenon that people refer to as the “school-to-prison pipeline?” In this module, you will use ratios, percents, data analysis, and probability to try to answer these questions.
x.1 Objectives
By the end of this module, students will be able to:
● Construct ratios and percentages from raw data in multiple forms, including fractions and decimals, that will be used to interpret information related to school discipline.
● Judge the validity of claims related to school discipline and using ratios and percentages.
● Explain the meaning of a probability statement and its connections to school discipline.
● Articulate if two related events are mutually exclusive and apply this skill to make judgments about the school-to-prison pipeline.
● Calculate the probability of an event not happening and apply this skill to make judgments about the school-to-prison pipeline.
● Calculate the sum of probabilities for multiple outcomes and apply this skill to make judgments about the school-to-prison pipeline.
● Calculate the probability of two or more independent events occurring using multiple methods, including a formula and a simulation, and use this skill to make judgments about the school-to-prison pipeline.
x.2 Understanding the Issue
In the wake of racial justice
protests in 2020, the public’s attention was also turned to the presence of
police in schools, and the disproportionate impact that this presence has on
students of color, primarily Black and Indigenous students. According to the
National Center for Education Statistics [8], 61.4% of the public schools in
2017-2018 had one or more security staff. The number of police officers in
schools especially exploded after the mass shooting in Columbine High School in
1999, as a consequence of which the government began to offer federal grants to
schools for hiring police officers in an effort to increase school security.
Twenty years later, over 200,000 students
are being referred to law enforcement every year. Some of these referrals are
arrests with or without charges filed, while others are citations. Students are
referred to law enforcement for offenses as minor as talking back to a teacher
or having a fight with a classmate. Because students who have contact with law
enforcement are more likely to drop out of school and/or end up incarcerated,
this increased criminalization of youth behavior has become known as the school-to-prison pipeline.
In this module, we will barely
scratch the surface of this huge problem. After the completion of this module,
you are encouraged to do more research on the topic, especially if you have not
been personally affected by the overpolicing and overdisciplining in schools. Most of the data used in the
module comes from a report by the American Civil Liberties Union, “Cops and no
Counselors: How the Lack of School Mental Health Staff is Harming Students”
[2]. It is important to acknowledge that neither race nor gender are discrete
categories in the real world. However, all the data sources used in this module
assume two genders and separate race categories. We will have to work with
these limitations, but it is worth asking of all data we encounter: how were
these data collected and what assumptions were made in collecting them?
In order to engage with this module,
you will need to know some terminology:
School resource officer: School resource officers (SROs) are sworn law enforcement
officers who are at a school part-time or full-time to maintain school safety
and prevent crime. These officers may educate and counsel students, but
otherwise have similar responsibilities as police officers. In particular, they
can make arrests on school property.
School arrest: This
is an arrest that happens on the school grounds, often, but not always, by the
school’s SRO.
In-school suspension: When a student commits an offense that the school considers worthy of
suspension, the suspension may be completed at the school. Suspended students
do not attend regular classes or interact with their peers but are in a
separate room where they are required to complete their assignments.
Out-of-school suspension: This is a more traditional form of suspension where
students are physically barred from school grounds for one or more days.
Zero tolerance policies: School discipline policies that require predetermined
serious consequences for particular offenses. Originally, these policies
specifically addressed possession of weapons and drugs but were also expanded
to others, such as defiant behavior or not following the school dress code.
Pushout: This
term is often used instead of “dropout,” since it can be argued that students
do not drop out of school unprompted, but as a consequence of policies and
actions that make it difficult or impossible for them to remain in school.
Students with disabilities: For the purpose of looking at school discipline, students
with disabilities are those who require special education services due to a
disability. If a student has a disability but does not need accommodations for
it, that student is not considered to fall under this category.
Truant: A student with a large number of
absences, usually set by an official standard like a school board or regulatory
agency.
The descriptions of the following
four terms were adapted from [2].
School counselor: These are professional staff members who counsel students and parents,
consult with other staff, evaluate students, and implement guidance programs.
They are among the first staff members to work with students who are
struggling.
Social worker:
Social workers assist students and families with issues such as poverty,
homelessness, lack of access to healthcare, domestic violence, and other issues
that might affect student performance at school.
Psychologist:
School psychologists help diagnose problems of a personal and educational
nature in students, and evaluate student social, emotional, and intellectual
development.
Nurse: School
nurses are qualified nurses who assist with the health needs of students at
schools.
x.3 Cui Bono – Who Benefits?
Strict school discipline is supposed to make parents feel safer sending their children to school, and it is also supposed to make the classroom environment more conducive to learning, with fewer distractions. Families of students who are not being disciplined might welcome, for example, presence of police in schools or zero tolerance policies. It could also be argued that teachers and administrators can benefit from not having to spend time and energy on students they view as disruptive.
x.4 The Big Problem: School-to-prison pipeline
Why do schools
discipline so many students? Why do students get arrested at school? Who is
most affected by school discipline policies?
To understand what the school-to-prison pipeline is, we need to learn some history of police presence in schools and of strict school discipline policies. We will use ratios and percentages to understand how school discipline has changed over time. We will use these same mathematical topics, along with probability, to see how school discipline does not affect all students the same, and in particular that there are certain groups of students that are disproportionately affected by these policies.
x.5 Mathematics Topics
x.5.1 Ratio
A ratio is a mathematical tool for
comparison. Ratios can be used either visually or numerically to compare
quantitative data. With a ratio, you can either compare two parts of a group to
each other, or you can compare a part of a group to the whole group. For this
section, the focus is on the comparison of parts of the group to each other,
specifically using the context of school support personnel.
First, there is a need to explore the
different forms that a ratio can take. There are three main ways a ratio can be
expressed:
- A verbal form (the ratio of part
to part)
- A colon form (part: part)
- A fraction form (
 )
)
Each of these is read the same way as
the verbal form, the ratio of part to part. The main significance is
recognizing the notation when you come across it in readings. To avoid
confusion, most writers will present ratios using a colon form (part: part) and
reserve fraction form for comparisons against the whole. The same convention
will be followed in this module and other portions of this text (?).
x.5.2 Percents
Percents will be used heavily in this module.
There are only two formulas you need to know:
x.5.2.1 Percent formula
part/whole = percent/100
You can use this formula when you are
missing the part, the whole, or the percent.
x.5.2.1.1 Example: In 2013-14, there were approximately 49 million students enrolled in
public schools. Out of those students, 5.3% were suspended or expelled. How
many students were suspended or expelled?
In this case, we know the whole (49
million) and the percent (5.3), but we do not know the part. Therefore,
part/49 = 5.3/100 = 0.053, so
Part = 0.053*49=2.597, so about 2.6
million students were suspended or expelled in 2013-14.
x.5.2.1.2 Example: In 2015-16, 43.42% of the students, or 21,700,551 students, were in
schools with police officers. How many total students were enrolled in schools
in 2015-16?
Now we know the part (21,700,551) and
the percent (43.42), but not the whole, so in this case,
21,700,551/whole = 4342/100=0.4342,
and
Whole = 21,700,551/0.4342 =
49,978,238, so there were 49,978,238
students enrolled in public schools in 2015-16.
x.5.2.1.3 Example: In 2015-16, 61,812 students were
arrested out of 49,977,268 who were enrolled nationally that year. What
percentage of the student population was arrested that year?
We know the part (61,812) and the
whole (49,977,268), but not the percent, so
61,812/49,977,268 = percent/100, or
0.00124 = percent/100, which means
that
Percent = 0.00124*100 = 0.124%, so
0.124% of all students were arrested.
Note that the part does not have to
be smaller than the whole. For example, 130 is 130% of 100. While in real life
we cannot give more than 100% effort, there are situations in which percentages
are over 100, for example if comparing two numbers (your pay may be 115% of
your friend’s pay) or calculating change (for example, the price of coffee may
have gone up 200%).
x.5.2.2 Percent change
Percents are often used to represent change.
For example, you may read that the number of suspended students in a school
increased by 13% in a year. How is this change calculated?
x.5.2.2.1 Example:There were 60,170 school arrests in
2013-14 school year, and 61,812 arrests in 2015-16.
The total change in the number of school arrests between these two
years is 61,812-60,170=1,642. To know what percent increase this is, we need to
compare to the original number, in this case 60,170:
1,642/60,170=0.027= 2.72%, so the
number of arrests went up by 2.72%.
More generally, the formula for
percent change from old value to new value is
![]()
where end value - start value is total change, and dividing by start value gives percent change. Note
that end value does not have to be
bigger than start value, in which
case we have a decrease and not an increase. For example, if the number of
arrests went down from 61,812 to 60,170, then the total change would be -1,642,
which is a 1,642/61,812=2.66% decrease. Note that in this case we divided by
61,812 because that was the starting value, and the percent decrease is smaller
than the percent increase, because the change of is the same in both cases,
while the starting value is different.
x.5.3 Probability
Probability is a specific type of
ratio that allows the comparison of specific outcomes with the entire group of
outcomes. We see probability expressed in three ways: as a fraction, as a
decimal, and as a percentage. All three of these expressions allow us to see a
part and a whole, even if in the case of decimals and percentages where the
whole is an adjusted quantity. We have two main ways that we think about
probability. One is what is called a theoretical
model. In the theoretical model,
probabilities are driven by expectations of what we know. One classical example
of a theoretical model is a coin flip where we know that there are two specific
outcomes. The second model is called an empirical
model, and it is based on directly counting the occurrences of outcomes.
The process of selecting objects to model a process is called a probability experiment. A probability experiment
offers a way to explore different outcomes, which we may also call events. We
can manually calculate the outcomes of a probability experiment, or use a tool
like a simulator to help us understand a situation that is represented in a
statement. Our choice to do this depends on the outcome or event that we might
be looking at.
Both theoretical probability and empirical probabilities have similar
building blocks. The sample space is
the collection of all possible outcomes. The probability is a ratio of the
specific outcome of interest over the total number of outcomes. In this module,
while we recognize the importance of understanding the underlying formulas for
probability, we rely on simulations to develop skills that link initial
statements of probability and the outcomes of experiments.
x.5.3.1 Exploration 1
Consider the statement: “All students feel safe to be themselves at
school.”
● What outcomes
are possible?
● Are there
reasons that might cause students to feel less safe about being themselves?
● Do you think a
student being themselves could make another student uncomfortable? Why or why
not?
The possible outcomes are {students feel comfortable, students do not
feel comfortable}, and that makes sense. The probability of a student feeling
safe to be themselves should result in 1 out of 2 outcomes. Ideally, students
feeling safe to be themselves at school should be the only outcome we expect to
see. In reality, we find that students do not feel safe to be themselves at
school for any number of reasons. Consider the following quote:
“The teachers … they thought we were selling weed in school,
they thought that me and her were both selling weed ‘cause
like, the way we were dressing, ‘cause we were the
only girls at that middle school that dressed like boys. So it was like “now
we’re bad.” (non-gender conforming youth from Arizona) [9]
In this quote, the student was exposed to a negative experience,
accusations of illegal activity, because of choices associated with how she
chose to express who she believed herself to be.
● Were there
incidents like this in your school?
Making Sense: Think back to your experiences in
school. Identify if there were similar incidents to the incident described
above in your community. Do you think that how people were seen by others
influenced their behavior, meaning if a label was applied to a person did they
adapt to the label? Or do you think that the person stayed the same?
The second type of probability that we use is the empirical model. This
comes from raw data. We tend to see this in the form of tables with numeric
values, instead of the summary statistics. The basic use of the empirical model
is very similar to the ideas from theoretical probability, and when we think
about how to make sense of data from a table of data we think about what the
theoretical model might have to look like.
x.5.3.2 Exploration 2
The data in the table below is taken from a report by the American Civil
Rights Union (ACLU) [2]. The report shows that students in these three states
have the same general probability of being arrested per 10,000 students. For
many states being arrested as a form of school discipline aligns with zero
tolerance offences that qualify for expulsion. For this reason, we may make a
reasonable assumption that students may not be arrested multiple times as a
form of school discipline.
State Total Students Total Arrests
Missouri 915,033 1,487
Arkansas 480,300 751
Rhode Island 141,210 231
Our first step to exploring the claim in the document is to think about
the probability that we want to build. If you are a student going to school,
when it comes to being arrested, you either get arrested at school or you don’t
get arrested at school. So we have two groups of students, those that get
arrested and those that don’t get arrested. We also happen to know about the
number of students that get arrested, as well as how many students there are.
This means that we have everything we need.
To find the probability of being arrested, we find the ratio of arrests
to students for each state. For the Exploration, we will model with Missouri
and you can test your ideas on Arkansas and Rhode Island.
arrests/(total students)=1487/915033
We can reduce this to a decimal figure, as finding common factors or a
reduced form fraction is highly unlikely. This yields approximately 0.001625.
Now we want to know how this fits with thinking about the probability of
being arrested per 10,000 students. In other words, if the probability of
getting arrested is 0.001625, this is about 0.1625%; how many arrests would
that be among 10,000 students?We use this previously
calculated value and solve an equation, to find a value out of 10000:
0.001625=p/10000
Solving this equation gives a value of 16 whole students in Missouri per
10000 based on the overall probability. The report claims that you have the
same probability per 10000 in all three states. Can you verify the claim?
x.5.4 More Complex Probability Pieces
Those are the basics of probability. We can use these basic
ideas of probability to help us build more complex models that can help us
build more complex structures.
x.5.4.1 The complement
The first of these complex structures is the complement. We
generally define this mathematically as the probability of an event of interest
not happening. If we revisit the exploration above in which we determined the
probability of getting arrested. We identified that there were two specific
groups, students that got arrested and students that did not get arrested. The
probability of not getting arrested can be found in two ways: either by
calculating it directly or by subtracting the opposite event from one.
x.5.4.1.1
Demonstration 1: To find
the probability of not getting arrested in school in Missouri:
We know that there are 915,033 total students, and we also
know that only 1,487 were arrested. So we know that the rest of the students
were not arrested. So, we can subtract the arrested students from the total
students to find the not arrested students, which gives us 913,546 students
that were not arrested. We then find the ratio of not arrested students to
total students: 913,546/915,033=0.998375, or around 99.3875%.
We can also find this by using the fact that we know the
probability of getting arrested. We start with the group of all students (1),
and then we subtract out the group that represents getting arrested: 1 -
0.001625=0.998375, or 99.8375%.
We get the same mathematical answers from calculating the
complement using either method. It is important to understand both methods
because we have to think about the different types of information that we might
have available.
What is something that we notice in this scenario? Can a
person be both arrested and not arrested at the same time? That leads us to our
second special scenario.
x.5.4.2 Mutually exclusive events
One consideration in probability is the consideration of if
events can occur at the same time. One example of events that cannot occur at
the same time are an event and its complement, so thinking about our prior
example a student cannot be both arrested and not arrested at the same time.
This is an example of mutually exclusive events.
But when we start to think about more complicated events, like can you be a
specific race and be suspended from school, the events become more complicated.
Understanding if events are mutually exclusive or not, allows for better and
more accurate methods of counting events. Having more accurate probability
calculations can help us make more informed judgments about issues.
x.5.4.2.1
Demonstration 1: Determine
if you think the following event pairs are mutually exclusive or not. Explain
to yourself why you think they are or are not mutually exclusive. What
information did you use to make your decisions?
Event Pair A: Being Black and Getting suspended from school
Event Pair B: Being truant and Having regular school attendance
Event Pair C: Making good grades and Being disciplined in school
Following up: Based on models we have looked at, like the
simulation at the beginning of the module, we realize that being Black and
getting suspended can happen together, so those events are not mutually
exclusive. When I know that being truant means not attending school regularly,
I realize that event pair B are complements and have to be mutually exclusive.
Event pair C is the most difficult to really take apart. Common sense wise and
experience wise it seems like maybe the people who got good grades didn’t get
in real trouble at school, but then again there is no reason why they couldn’t
get into trouble. This means that they have to be not mutually exclusive
events.
x.5.4.3 The Addition Rule
As mentioned above, sometimes there is a need to calculate
the probability of a combined event. In
this case, the event that we are looking at is the case where multiple outcomes
satisfy our conditions. Before we start considering answers we have to think
about if we have mutually exclusive events. Let’s explore two demonstrations
based on the same empirical data adjusted to percentages to help us understand
how to use the addition rule with mutually exclusive events and non-mutually
exclusive events.
The addition rule allows us to combine multiple events or
outcomes to find a total probability. There are two ways to think about this.
One perspective is to think about how one event influences a group. We are
thinking about school discipline, so we might think about how suspension
impacts different racial groups. We would see student race as an outcome and
suspension as a separate outcome. The other view of the addition rule is to
think about the total probability that a Latin@ student was disciplined at
school for a single offence. This would involve finding the probability that a
student could get detention, finding the probability that the student could get
in-school suspension, finding the probability that the student could get
suspended, finding the ways that the student could get arrested, and finding
the ways that the student could get expelled. There are several different
probabilities that we have to manage. We also have to realize that there is
overlap between getting arrested and getting expelled. Once we know the
probabilities and the overlaps, we can add the probabilities of the different
events together to find the total probability for the individual. Thes
x.5.4.3.1 Demonstration 1: Use the data from the
One issue that has been explored is the relationship between
suspension and high school completion. A national survey of 20,774 students in
middle school was conducted. From this survey data, 1673 students were
identified as having their first suspension within one year of the survey. 684
of these students were Black. In the study, 526 black students who experienced
their first suspension within one year of the survey successfully completed
high school. What is the probability that a randomly selected student in the
survey experienced a first suspension within one year of the original survey
and graduated high school if a student is Black? [adapted from 10]
Solving the problem: One of the first steps we have to follow
is to think about the events and data that we have. We have the total number of
students surveyed. We can think about this as an addition rule problem, because
we are taking groups and removing pieces from our groups. We know the total
number of students that experienced a first suspension within the first year
after the survey, and we also know the number of those students that are Black.
Further, we know how many of these students that were Black and suspended but
also graduated high school. We can use this to help us build a ratio.
![]() =
= ![]() = 0.0253
= 0.0253
Making Sense: Because we reference the original sample from
the survey, the whole for the ratio is the whole for the survey, the 20,774
students. By having very specific criteria, we created a very small group of
the original sample of students. This makes the probability very low. Do you think the probability is an accurate
depiction of what actually happens in the school systems?
Now let’s examine a more complicated simulator related to
school discipline.
x.5.4.3.2 Demonstration 2: Let’s consider how to complete a
calculation by hand using data from a graph. [Taken from 11]
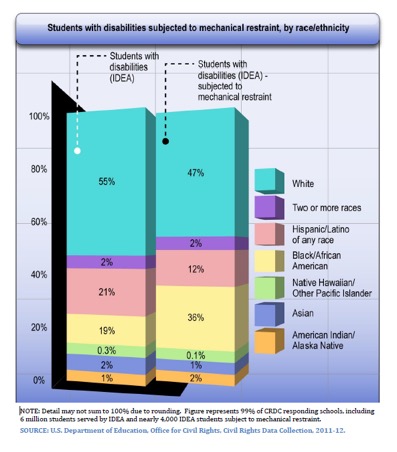
One theory that has been posed is that students that use a
heritage language in their home,meaning a non-English
language associated with their heritage, may be considered to have behavior
problems because they lack a common understanding of the English language. What
is the probability that a student is mechanically restrained and belongs to a
racial group associated with a heritage language?
Solving the problem: We have to decide which column is
relevant, students served by IDEA or students that have been mechanically
restrained. Since the question specifies that we are interested in restrained
students we are looking at the second column in the graph. Next we want to
think about groups that would be more likely to be associated with a heritage
language. Groups that identify as “Natives” tend to have a heritage language,
which means that the Native Hawaiian/Other Pacific Islander and American
Indian/Alaska Native groups both belong in this category. Many Hispanic
families are bilingual, although it is not always the case. For this problem,
we will assume that this will allow us to include the group. Our question now
becomes should we include the Asian students using the same reasoning? We would
need to include both groups if we are using the same underlying reasoning.
Now, we can start to calculate the probability. The presented
data is national data, and the groups we have are distinct groups, meaning that
if a student were to belong to two demographic groups they would actually fall
into the Two or More Races category.
Probability of restraint with a heritage language= (restraint
and Native Hawaiian/Other Pacific Islander) + (restraint and American
Indian/Alaska Native) + (restraint and Hispanic/Latino of any race) +
(restraint and Asian)
Probability of restraint with a heritage language= 0.1% + 2%
+ 12% + 1% = 15.1%
Making Sense: Based on our calculation, it appears that only
15% of the restrained students were likely to have a heritage language. How do
you think this influences the theory that students that have difficulty
speaking and understanding English are more likely to be disciplined?
x.5.4.4 Independent Events
There is another way to think about multiple outcomes, and
this happens when the events happen independently. In independent events, two
separate events happen that have the same underlying probability, or at least
we would like to think that they should (refer to x.5.3.1 Exploration 1 for
more detail). This is the crux of many arguments about school discipline. For
an event to be independent, the underlying probability of the event should be the
same across groups.
● From your
experience, do you think this is always the case?
● Are there things
that you think should be independent but are clearly not independent?
Let’s look at an example about how the math of independence
works.
x.5.4.4.1 Demonstration 1: Black students have a 17% chance of
being suspended. Consider each time a Black student gets called to the
principal’s office, what happens if two separate students get called to the
principal's office . Let’s explore the probability of both students receiving
the same outcome, meaning either both students get suspended or neither student
gets suspended.
What is the probability that both students are suspended?
![]()
What is the probability that neither student is suspended?
First, we need to know the probability of not being
suspended.
![]()
Now, we can use this to calculate the probability of neither
being suspended when called to the principal’s office.
![]()
When we have independent events that occur in a sequence, we
use multiplication to help us determine the probability. These are the
essential mathematical pieces that we need to help us evaluate claims about the
school to prison pipeline. Let’s dig a little deeper.
x.6 Solving for Change
x.6.1 What is the School-to-Prison Pipeline?
In this introduction to the module,
you will begin to think about the school-to-prison pipeline through engaging
with a quote and an infographic. Rather than give you data or answers, this
section gives you an opportunity to begin asking your own questions.
x.6.1.1 Questions
- What, if anything, do you know
about the school-to-prison pipeline?
- Read the following excerpt from
[6]:
“He was always a good boy. Polite,”
his grandmother says. “He was raised to be respectful.” So how did he end up in
prison? “It’s like they greased the chute. Back when he was in the 9th grade,
Kyron got into a fight. Boys fight. Always have. No guns, no knives, just two
boys tussling. Next thing I know he is locked up. That’s just crazy! It’s
wrong.”
a. What is your
reaction to this quote? Write at least three different things.
b. How might the
content of this quote be related to mathematics?
3. Consider the following infographic
[1]
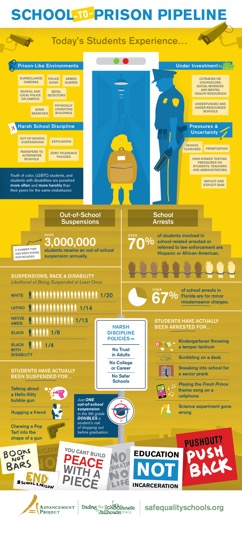
a. What do you
notice?
b. What do you
wonder?
There is no right or wrong way to
notice and wonder, so please list as many observations and questions as you
can. Are any of your noticings and wonderings related
to math?
This topic may be new to you, and it
also may be one that personally affects you. If you have personal experiences
with school discipline and police in schools, please engage with this module at
your own pace and comfort level. If you know little or nothing about these
topics, the following sections will provide you with more information about the
problem.
x.6.2 History of police in schools
In this part of the module you will
learn about the presence of police in schools and about the prevalence of
school shootings. Before you read on, answer this questions:
- What do you know about police
officers in schools?
- Did you go to a school with an
SRO?
- Why would schools have SROs?
x.6.2.1 Exploration: School resource officers in schools
Consider the table below, giving the
number of school resource officers, number of public schools, and the number of
public schools with school resource officers, by full- and part-time school
resource officer status, 2003–04 through 2015–16 [7]:
|
Characteristic |
2003-04 |
2005-06 |
2007-08 |
2009-10 |
2015-16 |
|
Public school resource officers |
34,000 |
36,700 |
46,100 |
40,200 |
52,100 |
|
Full-time public school resource
officers |
16,100 |
19,400 |
24,500 |
21,100 |
28,600 |
|
Part-time public school resource
officers |
18,000 |
17,300 |
21,700 |
19,100 |
23,500 |
|
Public schools1 |
80,500 |
83,200 |
83,000 |
82,800 |
83,600 |
|
Public schools with school resource
officers |
26,000 |
26,900 |
29,400 |
25,700 |
35,100 |
|
Public schools with full-time
school resource officers |
13,900 |
15,700 |
15,900 |
14,700 |
18,300 |
|
Public schools with part-time
school resource officers |
15,700 |
14,900 |
17,000 |
13,000 |
17,600 |
|
1Detail may not sum to totals
because schools that reported both full-time and part-time school resource
officers are only counted once in this total. |
|
NOTE: Detail may not
sum to totals because of rounding. School resource officers includes all
career law enforcement officers with arrest authority, who have specialized
training and are assigned to work in collaboration with school organizations.
In 2003–04, schools reported on school resource officers present at their
school on a regular basis. In 2005–06, 2007–08, 2009–10, and 2015–16, schools
reported on school resource officers present at their school at least once a
week. The number of school resource officers includes both full- and
part-time school resource officers. The number of schools with school
resource officers is defined as those schools providing a non-zero response
to the count of school resource officers question. |
- Give at least three observations
you can make about the data in the table.
- How much did the number of SROs
in schools change between 2003-04 and 2015-2016? Give the total and
percent change.
- What percentage of schools had
SROs in 2015-2016? How did that change from 2003-4?
- Why do you think the number of
SROs has gone up so much since 2003?
You probably notice from doing this
exploration that the number of SROs and the number of schools with SROs has
gone up. In the next exploration we will consider one possible reason for this
increase.
x.6.2.2 Exploration: School shootings as a reason for police presence
According to [2, p. 8],
“Following the 1999 Columbine High School shooting, President Clinton
called for the first round of Community Oriented Policing Services (COPS) grants
as a response that would allow for school/police partnerships focused on
“school crime, drug use, and discipline problems.” COPS is a unit of the U.S.
Department of Justice. After the Sandy Hook tragedy in 2012, President Obama
allocated another $45 million into COPS to fund additional school police.
Federal grants were supplemented by state grants and local monies to sustain
SRO programs.”
In other words, highly publicized
school shootings were part of the impetus for increased presence of police in
schools. But how common are school shootings? Consider the infographic below
[3]:
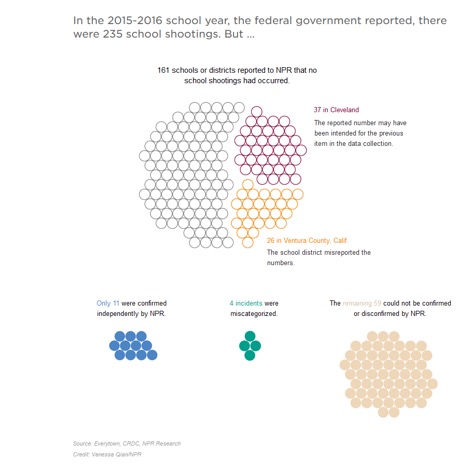
- According to a previous table,
there were 83,600 public schools in 2015-16 in the U.S. Using the
infographic above, what is the smallest and largest percentage possible of
schools that had a shooting in that school year?
- How are these percentages
similar to or different from your perceptions about how frequent school
shootings are?
- Based on the percentages you
calculated and the infographic, do you think that police presence in
schools is needed to reduce the risk of school shootings? Justify your
answer.
x.6.2.3 Summary
The presence of police officers in
schools has significantly increased since 1999 in response to the Columbine
High School and other shootings. The majority of public schools have a
part-time or full-time SRO on campus. While school shootings get a lot of
publicity, they are very rare. In the next section we will look at other
supports that have been considered important for preventing school shootings
and for improving well-being of students.
x.6.3 Presence of other student supports in schools
It has been argued that to prevent
shootings, schools should invest in supporting students’ mental and physical
well-being. However, in most states, there is a shortage of nurses, social
workers, psychologists, and counselors in schools. In this section, you will
compare numbers of school support staff (including SROs) in different states.
Before you continue, answer the
following questions:
- Was there a nurse, social
worker, psychologist, and/or counselor in schools you went to?
- How common do you think these
support staff are in schools?
We will first look at Delaware and Washington, DC as examples, and then you will have a chance to look at your own location if it is different from these two.
x.6.3.1 Exploration: School support staff in Delaware
Use the following applet to help you
explore the following guiding questions about school support staff in the state
of Delaware [2].
- Which pieces look to be similar
in size? Are there relationships between the piece sizes?
- Show the names of the sections.
Use this to help you refine your discussion above.
- Now select the option that
allows you to see the number that corresponds with each section. Do the
numeric values change any of the relationships that you developed? Are the
numbers closeWindow() to the same values?
https://www.geogebra.org/classic/n6ekzput
In the previous exploration, certain
pieces were generally the same size even though they did not hold the same
numeric value. Let’s take a minute to explore that difference between the
visual representation and the numeric data.
x.6.3.2 Analysis: School support staff in Delaware
The orange slice (security guards,
47) and the golden slice (social workers, 54) looked to be about the same size,
but the numbers were different. How do we make sense of the disagreement?
If I construct a ratio that compares the two parts what will that look
like?
![]()
But I am comparing things, not the pieces of the pie chart.
.
![]()
I am working to make sense of the quantities, so I should substitute the
quantities.
![]()
I see that these numbers are closeWindow(), but not the same. What happens in the
ratio when I round each number to the tens place.
![]()
I know that I can reduce fractions, so I must be able to reduce ratios,
too.
![]()
So even though the numbers are different, I can still think of them as
being roughly the same. I would say that the ratio of security guards to social
workers is approximately one to one or roughly one to one. It is not exactly
one to one because the numbers are not the same, so the choice of wording is
very important.
x.6.3.3 Exploration: School support staff in Washington DC
Examine the following table with data
for the school support staff in the Washington DC school district [2].
|
Counselors |
Social Workers |
Psychologists |
Nurses |
Law Enforcement |
Security Guards |
|
235 |
223 |
198 |
154 |
154 |
333 |
- Look at the numbers for the
groups and make comparisons between the groups.
- Does rounding to the tens place
allow for generating any interesting ratios?
- Are there any exact ratios?
- Critical thinking: How does the
ratio of (Law Enforcement + Security Guards):(Counselors+Social
Workers+Psychologists+Nurses) look? Were you
expecting it to be closeWindow()r together or further apart? How does this help
you think about the school-to-prison pipeline?
In the next exploration you will have
a chance to look at your state or a state that you are interested in.
x.6.3.4 Exploration: Numbers in your state
Read the following excerpt from [2,
p.11]
Given the importance of these providers, experts and professional
organizations provide recommended student-to-SBHM provider ratios. The American
School Counselor Association recommends a ratio of 250 students per counselor.
The National Association of School Psychologists (NASP) recommends a ratio of
500-700 students per school psychologist, depending on the comprehensiveness of
services being provided. School Social Work Association of America (SSWAA)
recommends that social work services should also be provided at a ratio of 250
students to one social worker. Several states, along with the American Nurses
Association, recommend a ratio of one school nurse to 750 students in healthy
student populations.
- Refer to table below [2, p.17]
of the report to find the number of students in your state. Do not look at
other columns. You can choose the state where you currently live, the
state in which you were born, the state where you went to school, or even
just a state that interests you.
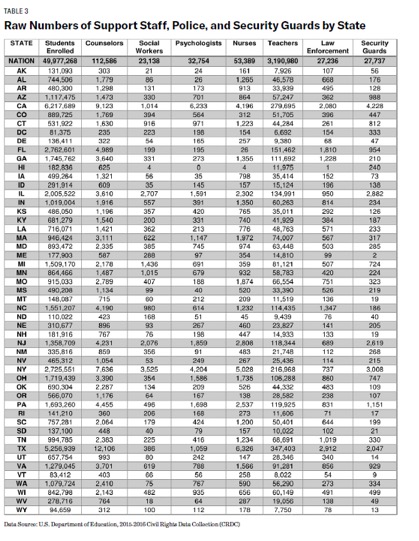
- Calculate the number of
counselors, school psychologists, social workers, and nurses that should
be employed in that state’s public schools according to the recommended
ratios from the paragraph.
- Compare your calculated answers
with actual numbers of counselors, social workers, psychologists, and
nurses in the table for your chosen state. How do the numbers compare?
- What did you learn from this
investigation and what do you still wish to know?
Summary
The majority of public schools have a
part-time or full-time SRO on campus, but not counselors, social workers,
psychologists, and nurses. This is true nationwide.
In the next section, we will get to the central problem with school discipline: that it affects different populations very differently. We will first look at arrests and then at suspensions.
x.6.4 Who gets arrested in schools
In this part of the module, you will
learn about school arrests. You will look at some national statistics to draw
conclusions about racial disparities that exist in school arrests.
Before you continue, answer the
following questions:
- How often do you think students
are arrested at school?
- Why do you think students are
arrested at school?
x.6.4.1 Exploration: School arrests
According to [2], there were over
230,000 referrals to law enforcement and 61,000 school arrests in the 2015-2016
school year. The report also states that the actual number is likely much
higher due to underreporting.
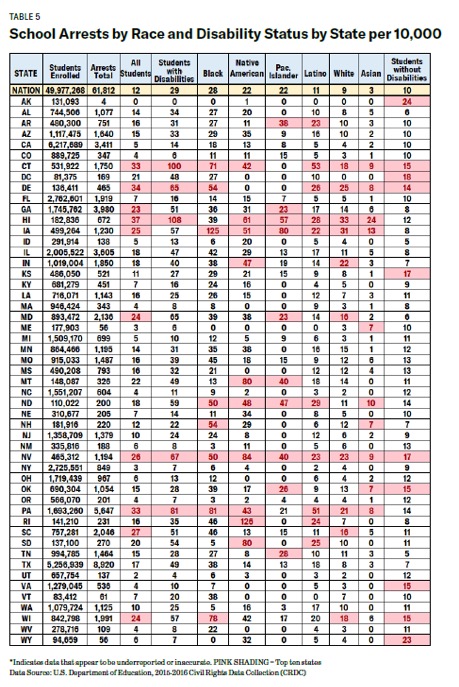
Consider the following table [2, p. 28]
that gives numbers and rates of school arrests by race and disability status by
state per 10,000.
- What do you notice about this
table? What do you wonder? Remember that there is no right or wrong way to
notice and wonder, but try to include mathematical observations.
- Notice that the first two number
columns give you whole numbers while the others give you rates. Explain
what the 12 in the Nation/All students cell in the table means.
- Using the data in the Nation
row, can you calculate how many students with disabilities were arrested
in 2015-2016?
- Are there any particular groups
of students who seem to be arrested more than others? What is your
evidence for your conclusion?
- Are there any particular states
or regions that seem to arrest students more than others? What is your
evidence for this conclusion?
x.6.4.2 Exploration: Reasons for school arrests
In addition to the previous table,
consider this one [2, p. 38]. This is a table of prevalence of incidents
classified as “serious offenses.”
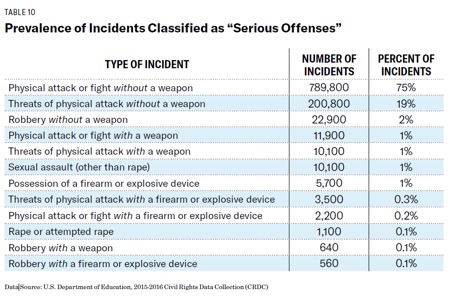
- Which of the offenses in the
table do you think should be considered serious enough to warrant an
arrest? Find how many of these offenses there were in 2015-2016. Compare
to the actual number of arrests in 2015-2016 (61,812). How do they
compare? What does that tell you?
- Assuming that arrests in schools
were made only for “serious offenses” (which is not necessarily true),
calculate what percentage of “serious offenses” resulted in an arrest.
- Again, assuming that arrests in
schools were made for “serious offenses” only, show that at least some
students were arrested for physical attack, fight, threat, or robbery without a weapon.
x.6.4.3 Summary
Large numbers of arrests are made in schools every year, most often not for dangerously serious offenses. The arrests are disproportionally among boys, Black students, and students with disabilities.
In the next section we will look at a more common form of school discipline: suspensions.
x.6.5 Who gets suspended from school
In this part of the module, you will learn about school suspensions and begin to make connections between school discipline and incarceration.
Before you continue, answer the following questions:
- Why do you think students get suspended from school?
- Are all groups of students equally likely to get suspended or are some groups suspended more than others?
x.6.5.1 Exploration: Prison population simulation
In this exploration, you will examine a data table that shows the overall
population for men's prisons by race [4]. Then you will examine three different
simulations to see which one you think would be most likely to produce the
prison population given. In reading the output from the simulations, there is
an overall summary column presented at the left. In the center, there are the
summaries from each trial. Then in the far right hand column, the raw data is
shown. The simulations model the selection of 50 individual prisoners in 25
repeated samples. Before you start working with the simulations (where you only
need to select “start” to collect data), think about strategies that you can
use to see if you think a model will match.
|
White |
Latinx |
Black |
Other |
|
29% |
18% |
34% |
19% |
Simulation A represents the general population according to the US Census.
Simulation B represents the percentages of
students suspended in schools.
Simulation C represents the percentages with all
groups being evenly distributed.
- The three simulations did not present an exact match to the prison
population, but which model do you think was the closeWindow()st to the prison
population model?
- What factors helped you make
your decision about fitting the model?
- What attributes does the model
hide by only presenting the proportions that would be useful in examining
the fit for the models?
- The simulations automatically calculated the percentages
of each population group. Explore the data that was produced in the
simulations. How could you start to think about how the sampler connects
with the outcomes?
Notes about probability: In the three simulations, the process was
modeled by picking balls from an urn. For the Exploration that you just
completed, the outcomes of the probability experiment you conducted were the
prisoners that were being simulated. There was also a specific group that was
counted to create each proportion. These specific groups were the races of
interest being counted. The probability is a ratio of the specific outcome of
interest over the total number of outcomes. In the simulations, we looked at
different races as the specific outcomes. It may be helpful to revisit the
exploration with this definition and see if any of your ideas change.
x.6.5.2 Summary
As is the case with arrests, Black
students, students with disabilities, and boys are disproportionately
disciplined at school.
In the last part of the module, it
may become more clear where the term school-to-prison pipeline comes from. As
it turns out, students who are disciplined at school are more likely to leave
school and have increased interactions with law enforcement.
x.6.6 Where is the pipeline?
In this part of the module, we return to the concept of the school-to-prison pipeline and look at some connections between suspensions, school pushout, and incarceration.
Before you continue, answer the following question:
- What long-term consequences may there be for students who are suspended from school or arrested at school?
x.6.1 Exploration: Data from Texas
In 2011,
researchers from the Council of State Governments Justice Center in partnership
with the Public Policy Research Institute at Texas A&M University published
a report [5] based on data from all public school students in Texas who were in
seventh grade in 2000, 2001, and 2002. The researchers followed these students
for at least six years, with access to academic and juvenile records. Among the
researchers’ findings was that only 3% of the offenses for which students are
disciplined are ones where by law schools are required to suspend or excel. The
other 97% are at administrators’ discretion.
The study also found that 59.6% of all the students were disciplined one or more times and 40.4% were not. The table below summarizes some of the outcomes for the different groups of students.
|
|
Students with disciplinary actions
(59.6%) |
Students without disciplinary actions
(40.4%) |
|
Held back a at least once |
31% |
5% |
|
Dropped out |
10% |
2% |
|
Juvenile justice contact |
23% |
2% |
1.
Using what you now know about ratios, percents,
and probability, explain whether the term “school-to-prison pipeline” is
justified for the students from this study.
- What else would you like to know to better answer this question?
x.6.2 Summary
Students who have been disciplined at school in Texas between 2000 and 2002 were much more likely to be held back a grade, drop out, or have contact with juvenile justice. These school discipline actions were 97% of the time at the administrators’ discretion and not mandated by school policies; and they had a lasting impact on a large number of students.
x.7 Reading Questions
- Was there a School Resource
Officer (SRO) in your elementary, middle, or high school(s)? If you are
comfortable, please share what your experience was like.
- How does the national SRO data
[7] compare to your own experience? (Note that the NCES data is only for
public schools and does not separate by grade level. You can look at the elementary, middle school, and high school data if you are interested.)
- What have you learned about the
presence of police in schools from this module? Based on your
investigations in this module, is police presence in schools beneficial,
detrimental, neither, or other? Please explain.
- What have you learned about
school arrests from this module? Do you think there are too many, too few,
or just the right number of arrests in schools? Justify your answer using
mathematics.
- What have you learned about
school suspensions from this module? Do you think there are too many, too
few, or just the right number of suspensions in schools? Justify your
answer using mathematics.
- Solutions: What are some things
that districts and states can do (or have done) to decrease the number of
arrests and suspensions, and to closeWindow() the racial gap in school discipline?
x.8 Exercises
- Using the mathematics from this
module along with additional sources you wish to use, make an infographic
about school discipline and school-to-prison pipeline.
x.9 References
- Advancement Project, The School-to-Prison Pipeline: Infographic (September 3, 2013), https://advancementproject.org/resources/school-prison-pipeline-infographic/.
- American Civil Rights Union, Cops and No Counselors: How the Lack of School Mental Health Staff is Harming Students (2019), https://www.aclu.org/sites/default/files/field_document/030419-acluschooldisciplinereport.pdf.
- A. Kamenetz, A. Arnold, E. Cardinali, National Public Radio, The School Shootings that Weren’t (August 27, 2018), https://www.npr.org/sections/ed/2018/08/27/640323347/the-school-shootings-that-werent.
- Bureau of Justice Statistics, Prisoners in 2018
(2020), https://bjs.ojp.gov/library/publications/prisoners-2018.
- T. Fabelo, M. D. Thompson,
M. Plotkin, D. Carmichael, M. P. Marchbanks III,
E. A. Booth, Breaking Schools’ Rules:
A Statewide Study of How School Discipline Relates to Students’
Success and Juvenile Justice Involvement (2011), https://ppri.tamu.edu/files/Breaking_Schools_Rules.pdf.
- C. Landry, Oklahoma Policy Institute, No Exit:
The School-to-Prison pipeline (Neglected Oklahoma) (August 27, 2014,
updated May 2, 2019), https://okpolicy.org/exit-school-prison-pipeline-guest-post-camille-landry/.
- National Center for Education Statistics, Number of school resource officers, number of public schools, and the number of public schools with school resource officers, by full- and part-time school resource officer status: 2003-04 through 2015-16 (2016), https://nces.ed.gov/surveys/ssocs/tables/tab_my01_2016_all.asp.
- National Center for Education Statistics, Percentage of public schools with security staff present at least once a week, and percentage with security staff routinely carrying a firearm, by selected school characteristics: 2005–06 through 2017-18 (2019), https://nces.ed.gov/programs/digest/d19/tables/dt19_233.70.asp
- Snapp, Shannon D., Jennifer M. Hoenig, Amanda Fields, and Stephen T. Russell. “Messy, Butch, and Queer: LGBTQ Youth and the School-to-Prison Pipeline.” Journal of Adolescent Research 30, no. 1 (January 2015): 57–82. https://doi.org/10.1177/0743558414557625.
- Mallett, Christopher A. “The School-to-Prison Pipeline: Disproportionate Impact on Vulnerable Children and Adolescents.” Education and Urban Society 49, no. 6 (July 2017): 563–92. https://doi.org/10.1177/0013124516644053.
- U. S. Department of Education Office for Civil Rights. “Civil Rights Data Collection: Data Snapshot (School Discipline).” Data Snapshot, March 2014. https://www2.ed.gov/about/offices/list/ocr/docs/crdc-discipline-snapshot.pdf.